
Figure 8.
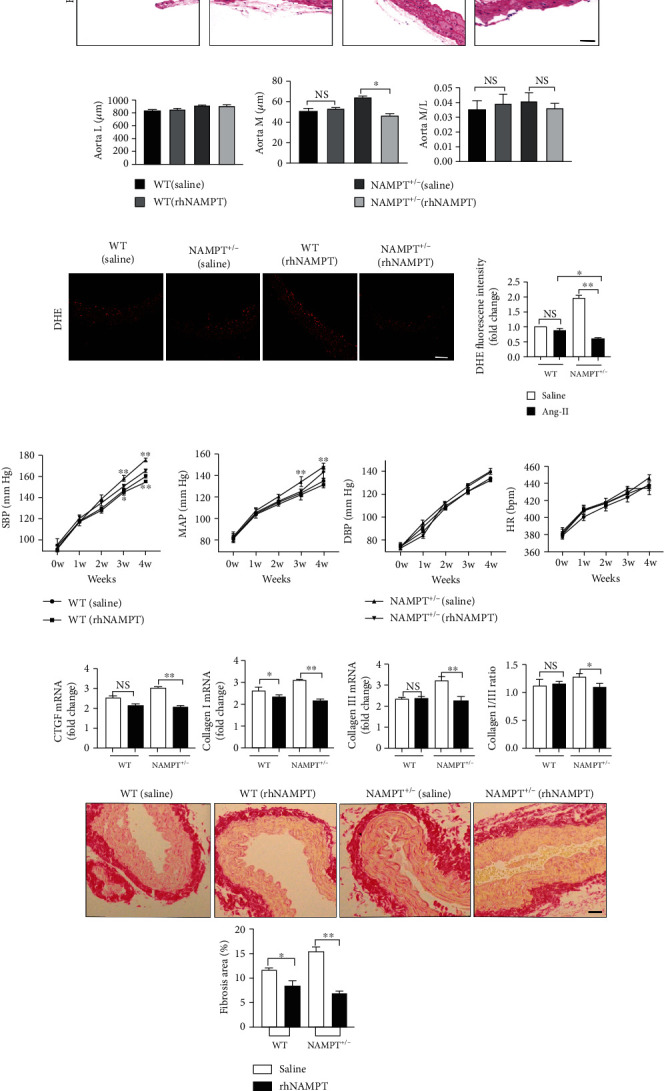
Therapeutic potential of rhNAMPT. (a) Representative images of H&E staining showing the remodeling of arteries (scale bar = 50 μm, n = 5 in each group, ≥40 fields per group). (b) M, L, and their ratio in the aorta. (c) DHE staining of fresh aortic wall tissues from NAMPT+/- and WT mice after Ang II stimulation and rhNAMPT administration (DHE (red); n = 6 in each group, scale bar = 500 μm). (d) The SBP, MAP, DBP, and HR were measured with a noninvasive computerized tail-cuff system in conscious mice. (e) Relative mRNA levels of CTGF, collagen I, and collagen III and the ratio of collagen type I and type III in WT littermates and NAMPT+/- mice treated with saline or Ang II treatment and injected with rhNAMPT (n = 6 in each group), as well as the picrosirius red staining (PSR). Data are presented as means ± SEM. ∗p < 0.05 and ∗∗p < 0.01 compared with the corresponding saline group; NS: not significant.