Fig. 3.
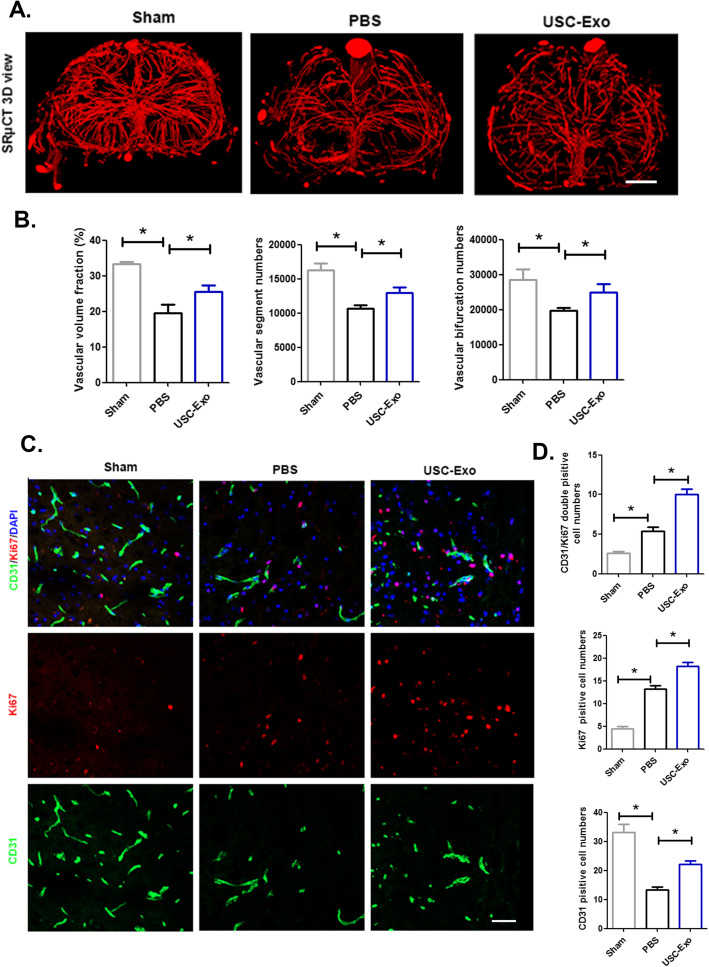
The administration of USC-Exo promotes angiogenesis after SCI. a Representative 3D image of spinal cord microvasculature at the T10 level per group at 56 days post-SCI visualized by SRμCT. Scale bars = 100 mm. b Quantification of the vascular volume fraction, vascular segment, and bifurcation numbers of the spinal cord among different treatment groups. c Representative immunofluorescence images of CD31 (green) and Ki67 (red) blood vessels in the mouse spinal cord in each group at 7 days post-SCI; scale bars = 50 μm. d Quantification of CD31 Ki67 double-positive cells in the spinal cords of mice among the different treatment groups. The data are presented as the means ± SD; n = 6 per group. *p < 0.05, **p < 0.01 compared among different treatment groups

