Fig. 5.
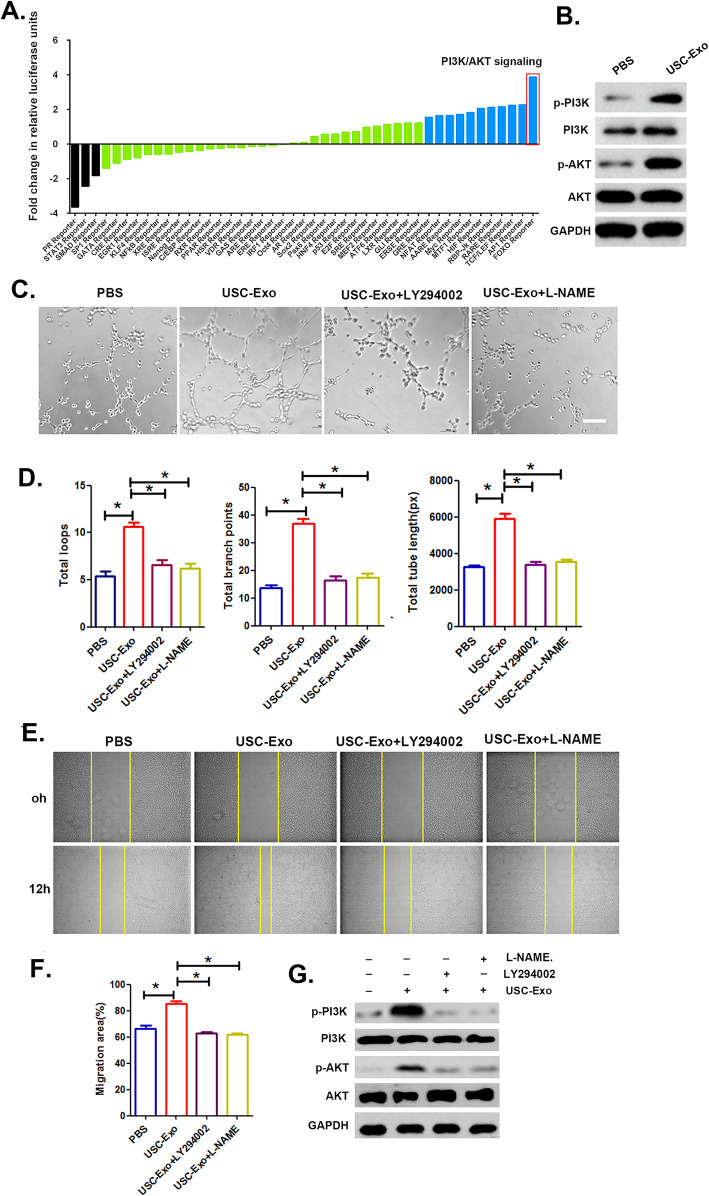
Comparison of 45 different signal transduction pathways following USC-Exo treatment in HUVECs. a Pathway reporters are listed by log2 ratio fold-change values in HUVECs treated with USC-Exo compared to cells treated with PBS. The results revealed that the PI3K/AKT signaling cascade changed the most in HUVECs after treatment with USC-Exo. b The expression of PI3K/AKT signaling pathway components in HUVECs after treatment with USC-Exo was detected by Western blot analysis. c Representative images of HUVEC tube formation in vitro after USC-Exo treatment with added LY294002 and L-NAME. d Quantitative analysis of the number of total loops, branch points, and total tube length shown in c. e Representative images of HUVEC migration in the USC-Exo treatment groups with added LY294002 and L-NAME in the scratch assay. f The percentage of the migration area calculated from e. g Western blot analysis of phosphorylated and total PI3K/AKT levels in HUVECs upon combination LY294002 and L-NAME treatment. The data are presented as the means ± SD; n = 6 per group. *p < 0.05, **p < 0.01 compared among different treatment groups

