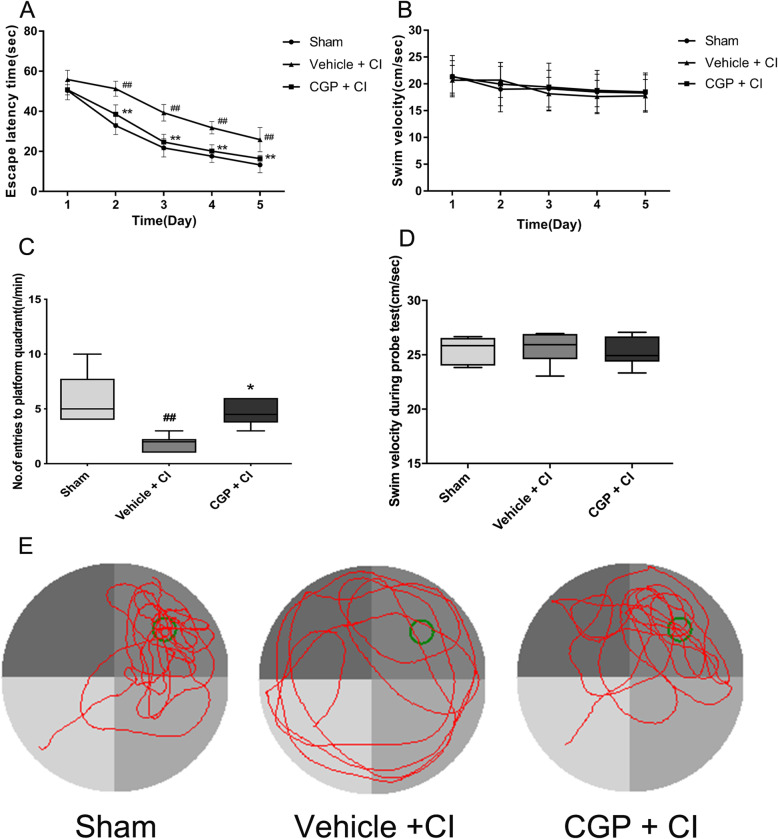
Fig. 2.
CGP facilitates cognitive recovery following CI (n = 6 mice in each group). a Escape latency to find the hidden platform in the place navigation test (the data are expressed as the mean ± SD). b No difference in swimming velocity was observed between the three groups in the place navigation test (the data are expressed as the mean ± SD). c Number of entries to platform quadrant in the spatial probe trial. d No difference in swimming velocity was observed between the three groups in the spatial probe trial. In this box and whisker plot (c, d), the line is the median, the ends of the box represent the upper and lower quartiles, and the whiskers represent the highest and lowest points. ##P < 0.01 compared with the sham group; *P < 0.05, **P < 0.01 compared with the vehicle + CI group. e The typical trajectories of mice in different groups in the spatial probe trial. Green circle indicates the location of the platform. Each mouse was performed to a 60-s probe test, where the platform was removed from its original location. The swimming trajectory shows that the mice of the vehicle + CI group explored all quadrants, while the mice of the sham group and CGP + CI group spend most of the time exploring target quadrants (two-way ANOVA with Tukey post-test)

