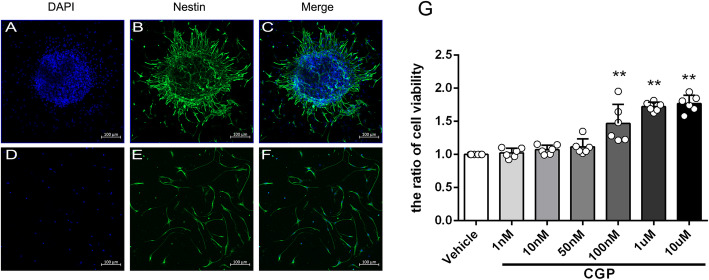
Fig. 5.
Identify NSCs and the effect of CGP on cell viability of NSCs. a–c The confocal microscopic images of neurosphere that stained with nestin (green) and counterstained with DAPI (blue) as the nuclear marker (scale bar 100 μm). d–f The confocal microscopic images of single neural cells stained with nestin (green) and counterstained with DAPI (blue) as the nuclear marker (scale bar 100 μm). g The histogram showing the cell viability values detected by the CCK8 assay for each group. **P < 0.01 compared with the vehicle group; #P < 0.05, ##P < 0.01 compared with the 100 nM CGP group (the data are expressed as the mean ± SD, n = 6 samples per condition; unpaired Student’s t test with Kolmogorov–Smirnov test)

