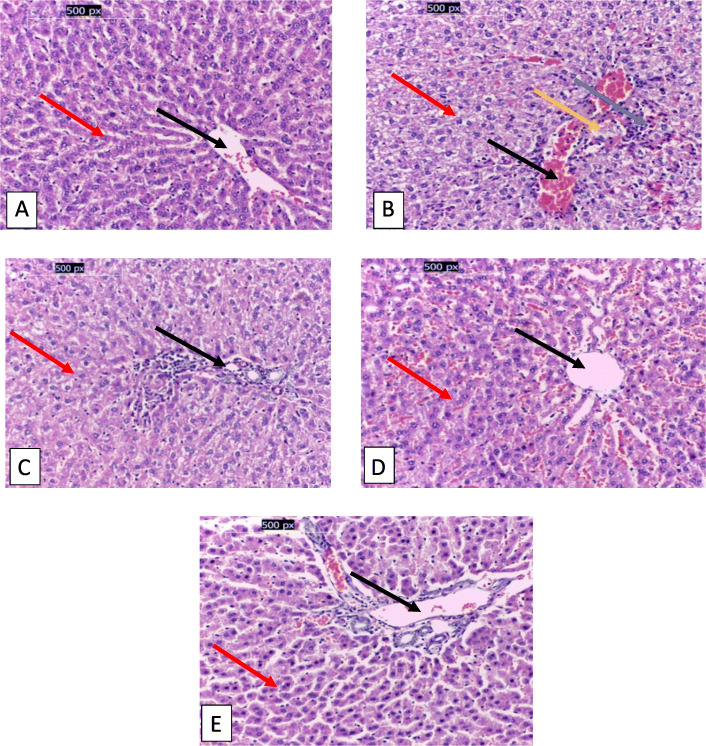
Fig. 3.
a,b,c,d,e. Microscopic images of liver tissue in the groups under study. a: Control negative group, showing the normal histological structure of hepatic tissue with normal cells (red arrow) and vein (black arrow), b: Control positive group, showing fatty infiltrated and degenerated hepatocyte (red arrow), congested vein and sinusoids (black arrow), degenerated biliary duct (orange arrow) and bridging necrotic cells (blue arrow), c: Green coffee methanolic extract group, showing nearly normal hepatocytes (red arrow) with mildly inflammated vein (black arrow). d: Silymarin group, showing mild fatty degeneration, mild inflammation and interstitial edema (red arrow) with normal vein (black arrow). e: Combination of green coffee methanolic extract and silymarin group, showing nearly normal hepatocytes (red arrow) and vein (black arrow). (X 400, H&E stains)

