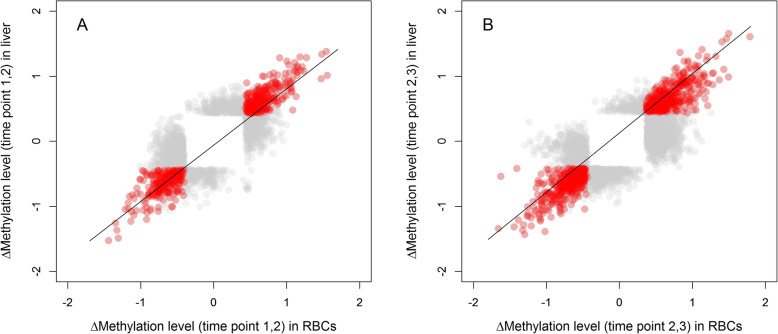
Fig. 1.
Correlation between CpG sites in RBCs and liver data that show a significant change in methylation for Δ1,2 (a) and Δ2,3 (b). Methylation change is visualized as the normalized change (z-scores). We depict sites that significantly change in methylation in both tissues (tissue-general change) in red (n = 537 for Δ1,2 and 853 for Δ2,3) or in one of the tissues (tissue-specific change) in grey (n = 1840 for Δ1,2 and 3081 for Δ2,3). We applied transparency because of the high number of overlapping data points. Line is the regression line

