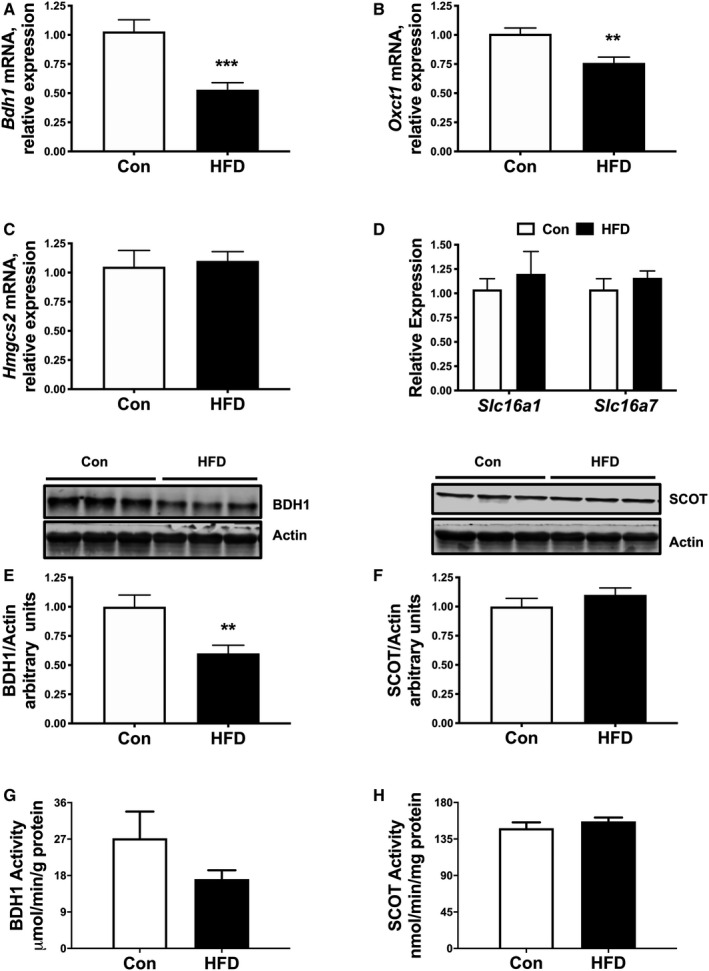
Figure 2. Regulation of ketone body utilizing genes, protein, and activity by high‐fat diet (HFD)‐induced obesity.

qPCR analysis showing expression of Bdh1 (A) and Oxct1 (B) in mice after 12 weeks of HFD or control diet (Con) feeding. mRNA expression of Hmgcs2 (C), and ketone transport genes, Slc16a1 and Slc16a7 (D) in ventricular tissue. Western analysis of whole cell extracts prepared from left ventricular heart tissue for β‐hydroxybutyrate dehydrogenase (BDH1) and succinyl‐CoA:3‐oxoacid CoA transferase (SCOT). E, Upper panel: Immunoblot illustrating BDH1 levels in ventricular tissue of HFD mice compared with Con mice. Lower panel: Densitometric analysis of immunoblots shown in upper panel. F, Upper panel: Immunoblot illustrating SCOT levels in ventricular tissue of HFD mice compared with Con mice. Lower panel: Densitometric analysis of immunoblots shown in upper panel. Cardiac BDH1 (G) and SCOT (H) enzyme activities in Con and HFD mice. n=6; Means±SEM. qPCR indicates quantitative polymerase chain reaction. **P<0.01; ***P<0.001; vs. Con.
