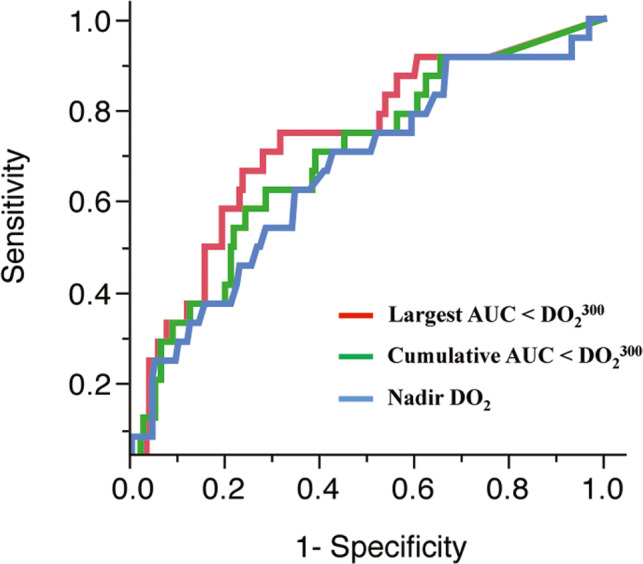
Figure 2. Comparison of receiver operating characteristic curve to predict acute kidney injury between the nadir oxygen delivery (DO2), cumulative area under the curve (AUC) below the , and largest AUC below the .

AUCs and P values are 0.663 (95% CI, 0.534–0.772) for the nadir DO2, 0.693 (95% CI, 0.568–0.795) for the cumulative AUC below the , and 0.733 (95% CI, 0.608–0.829) for the largest AUC below the , respectively. Differences between areas are 0.0691 (P=0.0061) for the nadir DO2 and the largest AUC below the , 0.0395 (P=0.0013) for the cumulative AUC below the and the largest AUC below the , and 0.0297 (P=0.25) for the nadir DO2 and the cumulative AUC below the , respectively.
