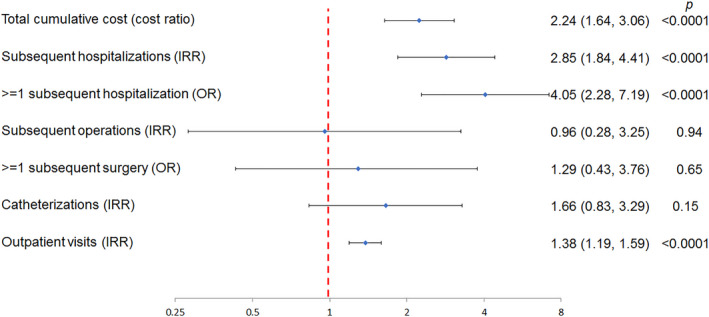
Figure 1. Association of prolonged LOS after operative correction and subsequent resource utilization in multivariable models.

This Forest plot depicts the results of a series of multivariable models evaluating the association between prolonged LOS after initial operative correction and subsequent measures of resource utilization. Point estimates for each model are depicted with a light blue diamond. Brackets represent 95% CIs. Point estimates and confidence intervals that are completely to the right of 1 (red dashed line) reflect increased resource utilization. Those that are completely to the left reflect decreased resource utilization. Each model is adjusted for sex, parental education, age at surgery, genetic syndrome, noncardiac congenital malformations, prematurity, and census region. The exception to this is the model of cost, which was not adjusted for census region. IRR indicates incidence rate ratio; LOS, length of stay; and OR, odds ratio.
