
Figure 3. The predictive value of specific G protein–coupled receptors (GPCRs) in postural orthostatic tachycardia syndrome (POTS).
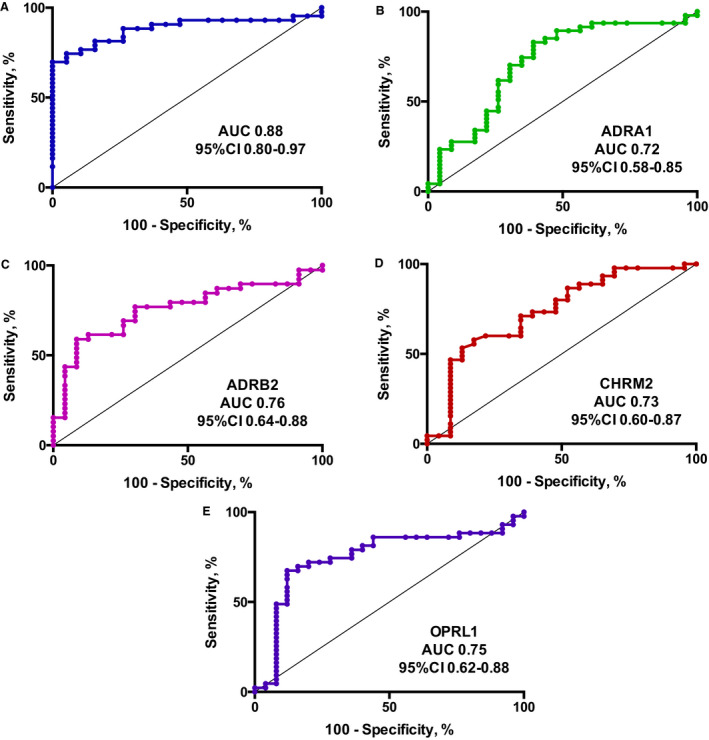
Receiver operating characteristic (ROC) curves for all 4 GPCRs (A) and the individual receptors (B through E) for the diagnosis of POTS in the 73 patients. A, ROC curve for all 4 GPCRs (ADRA1 [adrenergic α1 receptor], ADRB2 [adrenergic β2 receptor], CHRM2 [cholinergic muscarinic 2 receptor], and OPRL1 [opioid receptor‐like 1]) for the diagnosis of POTS. B, ROC curve for ADRA1 for the diagnosis of POTS. C, ROC curve for ADRB2 for the diagnosis of POTS. D, ROC curve for CHRM2 for the diagnosis of POTS. E, ROC curve for OPRL1 for the diagnosis of POTS. AUC indicates area under curve.