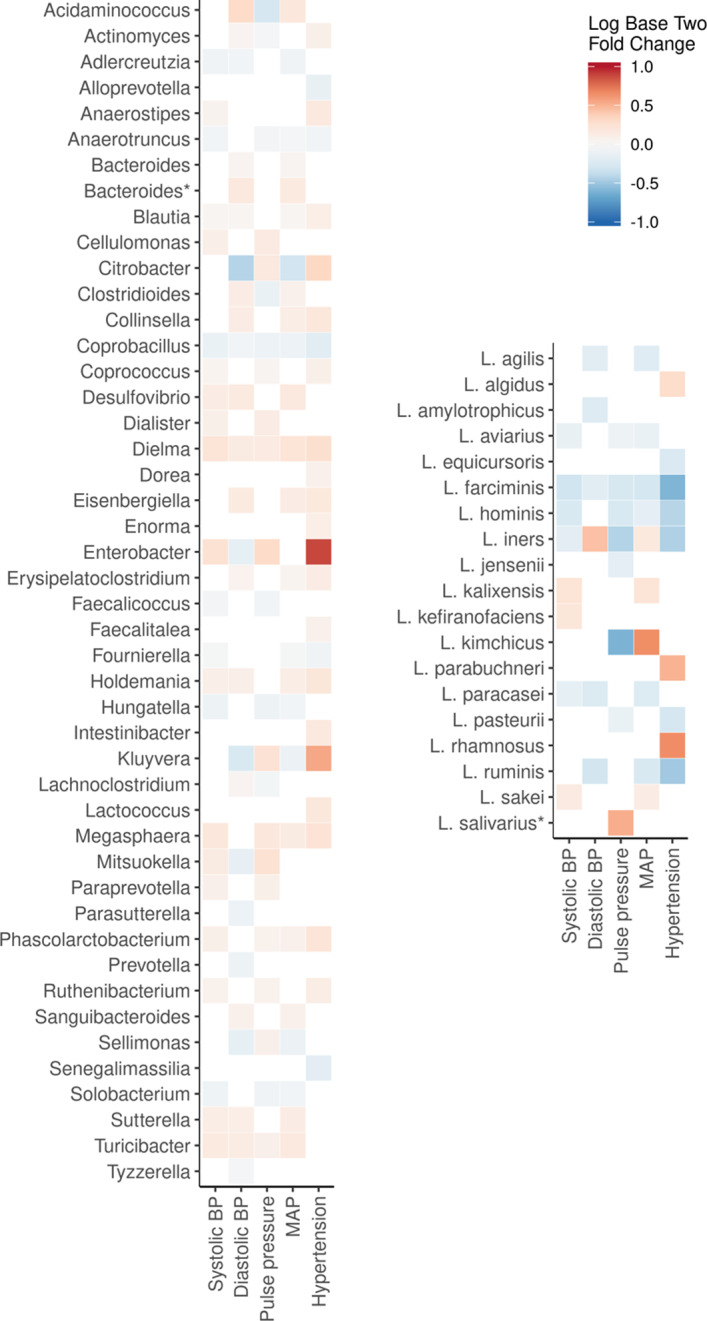
Figure 3. Associations for common microbial genera and Lactobacillus species with blood pressure (BP) indexes.

We observed 45 distinct microbial genera and 19 Lactobacillus species that were significantly associated with BP indexes using DESeq2 (P<0.05 for all). The heat map expresses the fold change associated with BP indexes in base 2 logarithm ratios of microbial abundances. For hypertension, the range signifies a change of microbial abundance from 0.5 (blue) to 2 (red) times the bacterial abundance in normotensive participants. For continuous variables, the fold change is expressed per 1‐SD change in BP variable. The models are adjusted for age, sex, body mass index, smoking, exercise, diuretics, β blockers, calcium channel blockers, and renin‐angiotensin system blockers. Association with bacterial plasmid is denoted using asterisk. MAP indicates mean arterial pressure.
