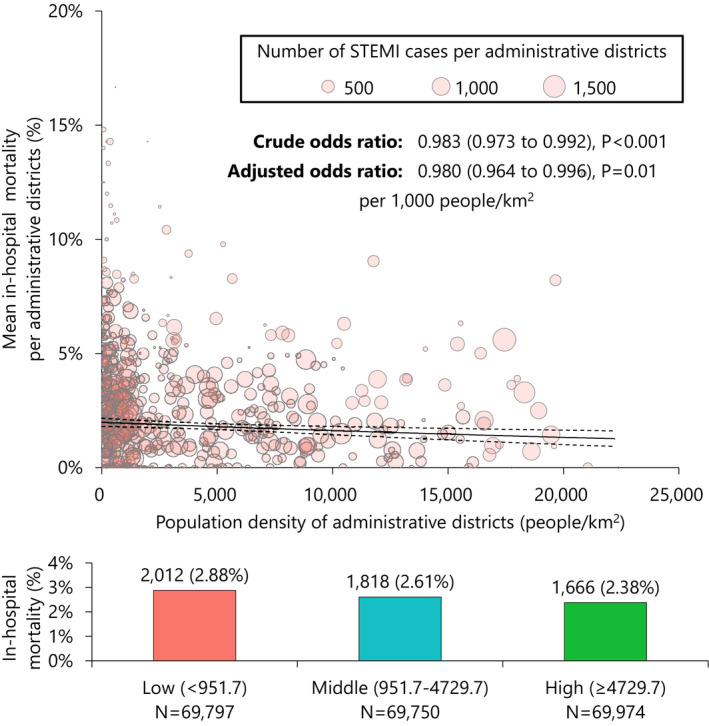
Figure 3. In‐hospital mortality according to population density.

In the upper panel, odds ratios were assessed by the univariate or multivariable generalized linear mixed model including population density of administrative districts as the exploratory variable and in‐hospital mortality as the response variable. Circles represents mean in‐hospital mortality over population density at each administrative district, while their size indicates number of patients with STEMI per administrative district. In the lower panel, the bar graph demonstrates in‐hospital mortality according to the population density tertiles. STEMI indicates ST‐segment–elevation myocardial infarction.
