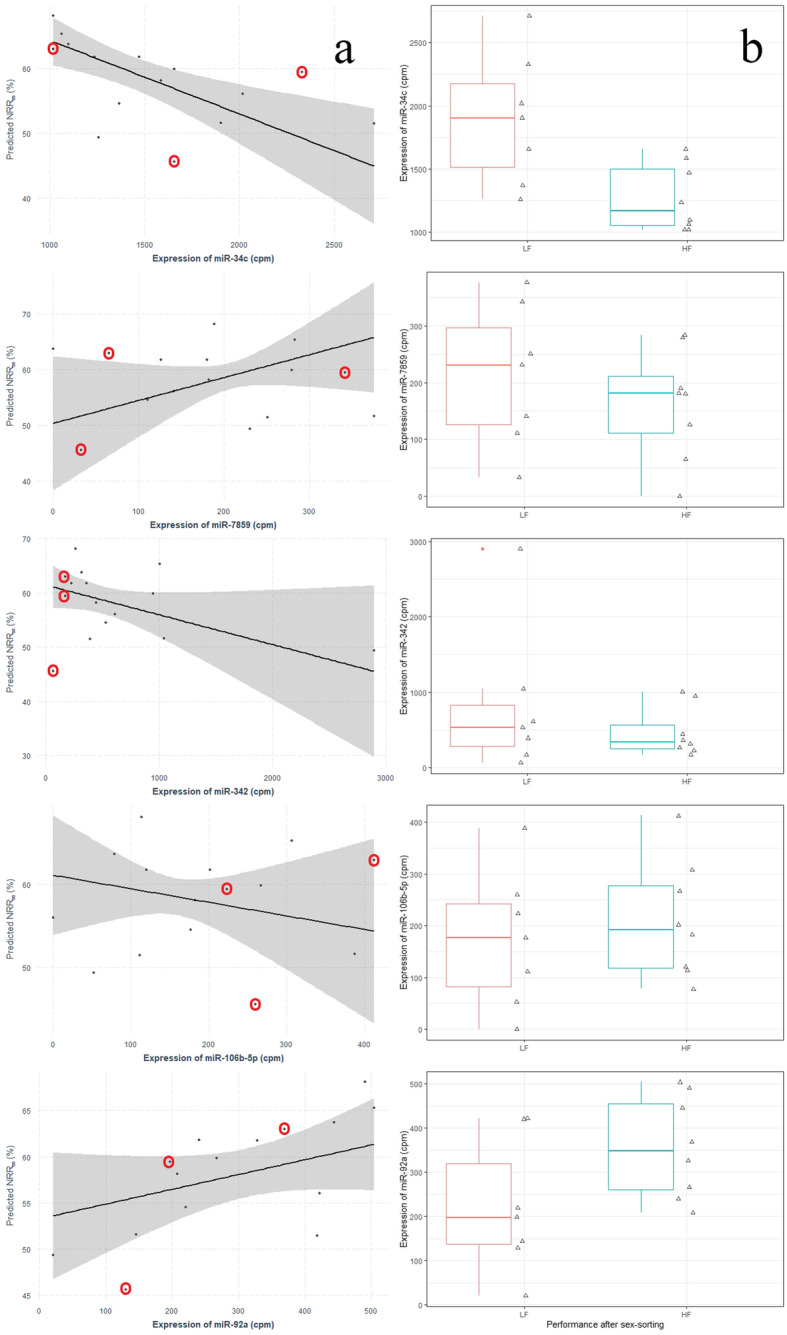
Fig. 4.

Robust regression lines of five miRNAs predicting the non-return rate for sex-sorted sperm (a); Tukey-style boxplots for the expression levels of the five miRNAs in the high-and low-fertility group (b). a. Robust regression lines with 95% confidence intervals (grey shaded area) for single predictors (predicted NRRss values plotted against the observed expression levels of single miRNA, when all other predictors are kept constant at their mean value) are presented. Plotted points represent the observed NRRss values; red circles indicate bulls identified and treated by the robust regression model as outliers in regard to their sperm miRNA profile. NRRss, 56-day non-return rate for sex-sorted sperm; cpm, count per million reads b. LF, low-fertility group; HF, high-fertility group
