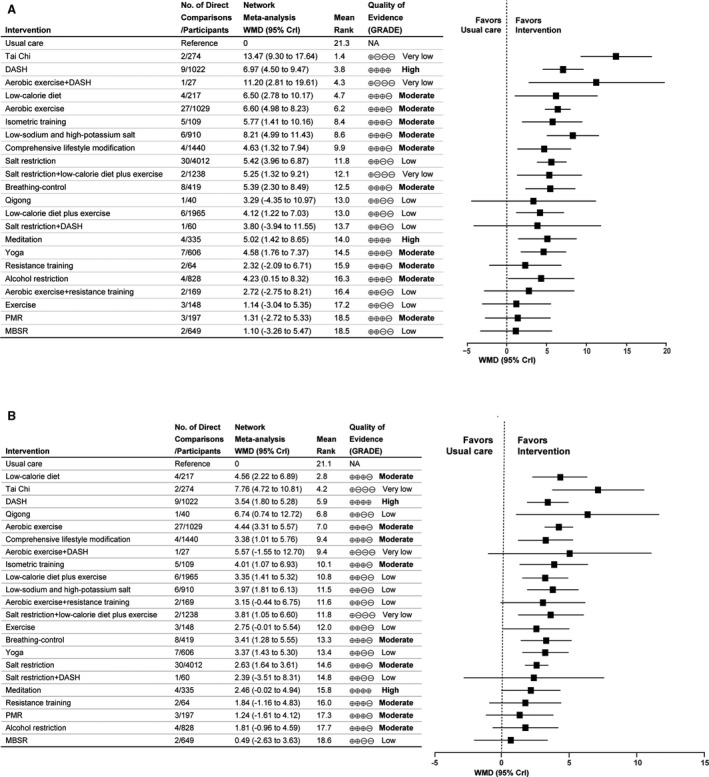
Figure 3. Forest plots for mean changes of blood pressure in adults with prehypertension to established hypertension.

A, Systolic blood pressure. B, Diastolic blood pressure. Mean changes of blood pressure are reported in WMD and 95% CrI for intervention vs usual care. Rectangle represents the point estimate for the effect of each intervention. Horizontal lines indicate 95% CrI. Tables on the left of the forest plot show, for each intervention, the number of direct comparison studies, number of participants, rankings of SUCRA probabilities and quality of evidence. Interventions are ranked according to the rankings of SUCRA. The quality of evidence was classified as high, moderate, low, or very low. CrI indicates credible interval; DASH, Dietary Approaches to Stop Hypertension; MBSR, mindfulness‐based stress reduction; NA, not available; PMR, progressive muscle relaxation; SUCRA, surface under the cumulative ranking; and WMD, weighted mean difference.
