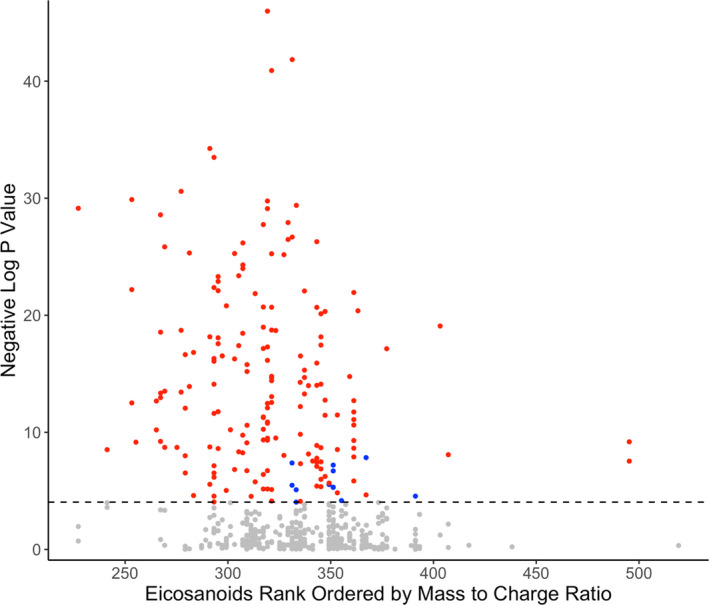
Figure 1. Manhattan plot for associations between metabolites and systolic blood pressure in FINRISK 2002.

A significant association was observed for 187 of the 545 eicosanoids. Positive correlations are denoted in red, negative in blue, and insignificant in gray. Eicosanoids are ordered by the value of mass/charge ratio. Dashed line represents the Bonferroni‐corrected (P=0.05/545) level of significance. Analyses are adjusted for age, sex, body mass index, current smoking, diabetes mellitus, antihypertensive medication, and batch.
