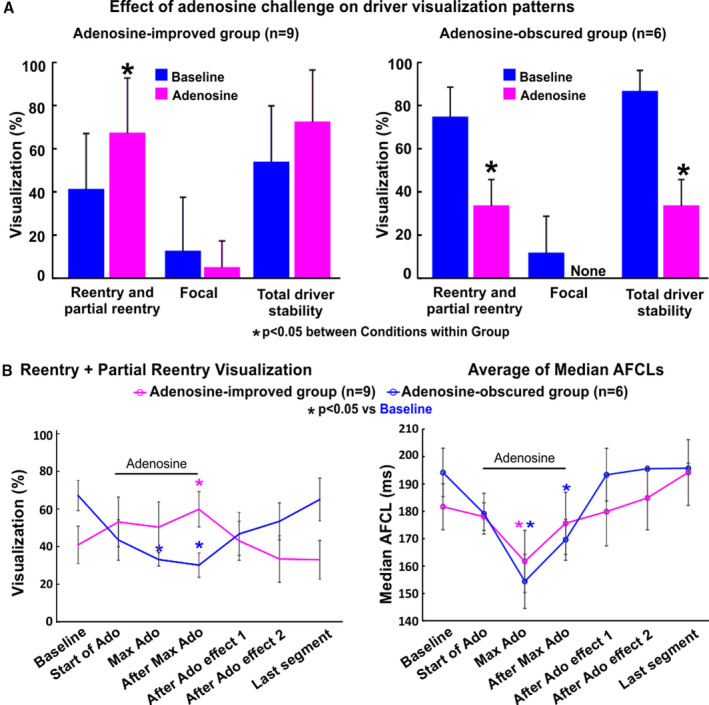
Figure 7. AF driver‐specific effect of adenosine challenge on driver visualization.

A, Driver‐specific effect of adenosine (Ado) on driver visualization pattern shows 2 distinct groups, unstable at baseline and adenosine‐improved, or stable at baseline and adenosine‐obscured. *P<0.05 between Conditions within Group. Statistical analysis was done using a general linear mixed model. Driver level responses are shown in Figure S11. B: Left, Driver visualization of reentrant and partial reentrant patterns across the 1‐minute recordings for adenosine‐improved and adenosine‐obscured groups. Right, Full‐basket average of median atrial fibrillation cycle lengths (AFCL) across the 1‐minute recording for adenosine‐improved and adenosine‐obscured groups. To normalize the time course of adenosine challenge across patients, we set start of Ado at the first 4s segment with increase in ventricular R‐R interval. Max Ado effect was by definition the segment with shortest median AFCL. After restoration of ventricular R‐R intervals to baseline values, measurements were taken at 4 seconds (After Ado Effect 1) and 8 seconds (After Ado Effect 2). Minimum time steps were 4 seconds, maximum steps did not exceed 16 seconds and the time between Baseline and Last segment did not exceed 56 seconds. Atrial fibrillation (AF) reentry visualization data are presented as average±SE. AFCL data are presented as average of medians±SE. *P<0.05 compared with baseline. Statistical analysis was done using general linear mixed model.
