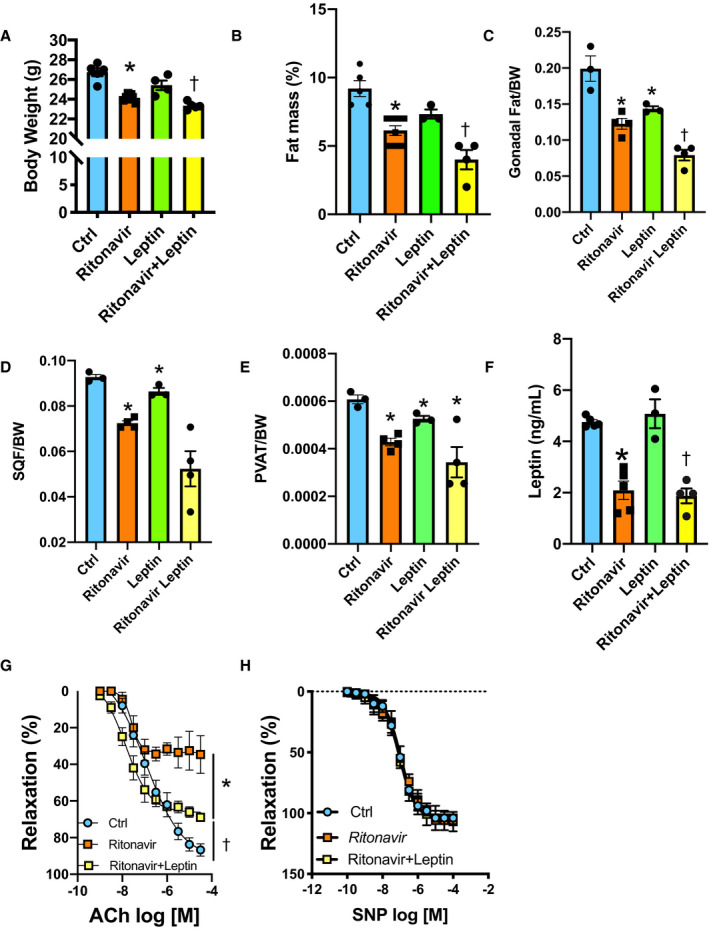
Figure 1. Ritonavir induces endothelial dysfunction via reducing leptin secretion.

Body weight (A), percentage of fat mass (B), gonadal fat depot (C), subcutaneous fat depot (D), PVAT, (E) leptin plasma levels (F), and concentration response curves to ACh (G) and SNP (H) in aortic rings from control (Ctrl, vehicle‐treated) and ritonavir‐treated mice (ritonavir, 5 mg/kg per day for 4 weeks, ip) in the presence or absence of leptin treatment (0.3 mg/kg per day for 1 week, via osmotic mini‐pump). Data are presented as mean±SEM. N=5 to 8; *P<0.05 vs Ctrl; † P<0.05 vs Ctrl and ritonavir. ACh indicates acetylcholine; BW, body weight; Ctrl, control; PVAT, perivascular adipose tissue; and SQF, subcutaneous fat.
