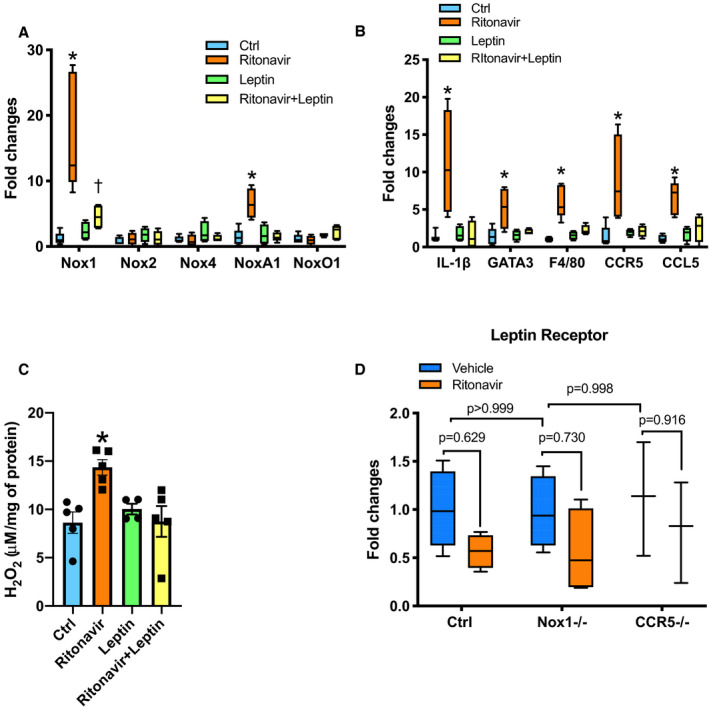
Figure 4. Leptin treatment decreases Nox1 expression and vascular inflammation.

Real‐time PCR quantification of aortic NADPH oxidases subunits (A), aortic inflammatory gene markers (B). Aortic H2O2 levels measured by Amplex Red (C) from Ctrl and ritonavir‐treated mice (ritonavir, 5 mg/kg per day for 4 weeks, ip) in the presence or absence of leptin treatment (0.3 mg/kg per day for 1 week, via osmotic mini‐pump). Real‐time PCR quantification of aortic leptin receptor (D) from control (Ctrl), Nox1‐deficient mice (Nox1−/−), CCR5‐deficient mice (CCR5−/−), and ritonavir‐treated mice (ritonavir, 5 mg/kg per day for 4 weeks, ip). H2O2 content data are presented as mean±SEM. Gene expression data are presented as Min. to Max. N=4 to 8; *P<0.05 vs Ctrl; † P<0.05 vs leptin and ritonavir. CCL5 indicates C‐C motif chemokine ligand 5; CCR5, C‐C chemokine receptor 5; Ctrl, control; F4/80, the macrophage marker F4/80; IL‐1β, interleukin‐1β; GATA3, GATA binding protein 3; Nox1, NADPH oxidase 1; PCR, polymerase chain reaction.
