Fig. 8.

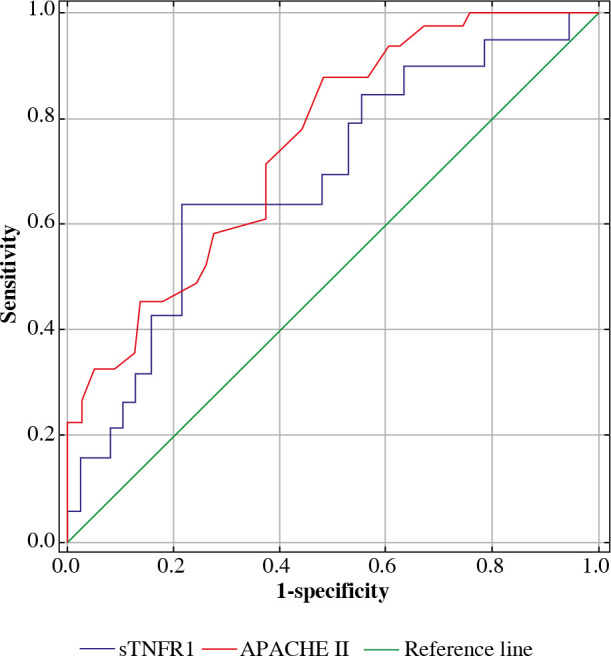
ROC curves for APACHE II and concentrations of sTNFR1 in the serum (pg/ml) of patients treated in ICU due to severe infections

ROC curves for APACHE II and concentrations of sTNFR1 in the serum (pg/ml) of patients treated in ICU due to severe infections