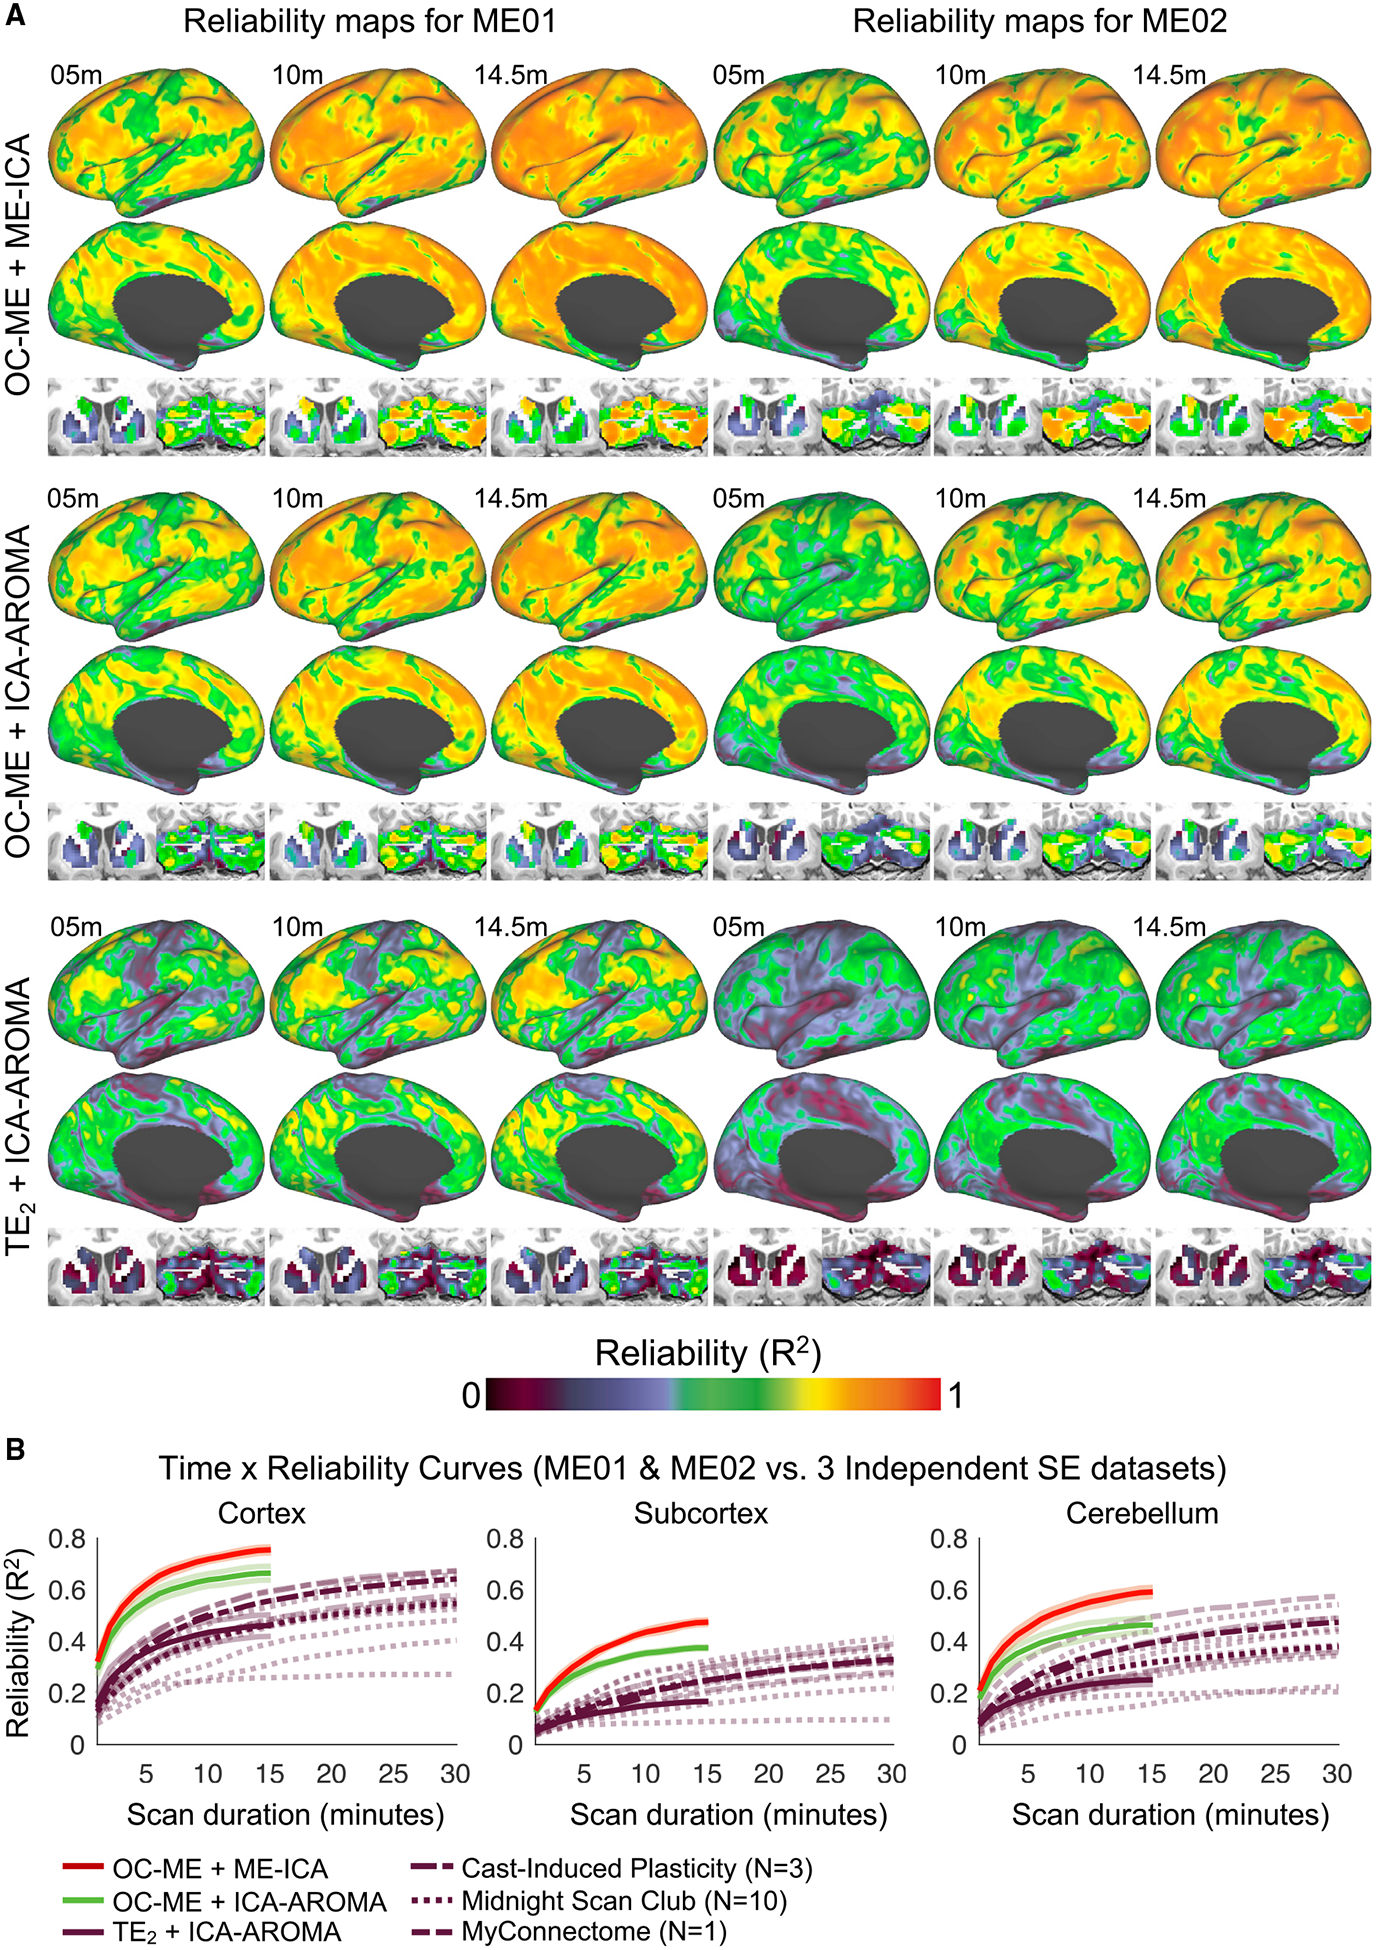
Figure 3. The Optimal Combination and ME Denoising Procedures Improve the Reliability of Resting-State FC Measurements in Two Densely Sampled Individuals.

The reliability of FC estimates in ME01 and ME02 after repeated imaging using a ME fMRI sequence (6 h total; 24 × 14.5-min scans acquired over a 9-month period).
(A) Reliability maps were calculated using three different denoising strategies, leveraging both (OC-ME + ME-ICA), one (OC-ME + ICA-AROMA), or no (TE2 + ICA-AROMA) benefits of ME fMRI.
(B) Time × reliability curves show the average reliability obtained in gray matter, subcortical structures, and the cerebellum given different scan durations. Curves from the independent SE MC and MSC datasets are provided as comparators. Transparent curves represent individual subjects. Solid lines represent the median curve within datasets. Note that the purple lines representing the different independent SE datasets can be distinguished by their unique dash spacing patterns. m, minute.
