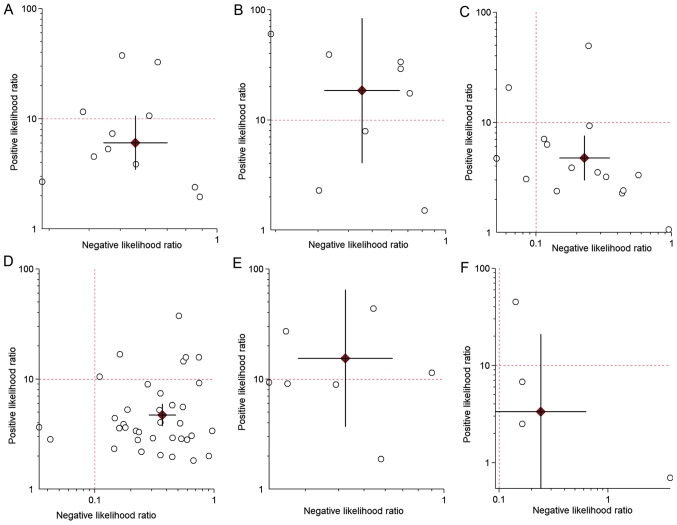
Figure 4.
Likelihood scattergrams. Scatter plots of (A) FDG PET for lymph node metastasis; (B) FDG PET for distant metastasis; (C) FDG PET for recurrent gastric cancer; (D) CECT for lymph node metastasis; (E) for CECT on distant metastasis; and (F) CECT for recurrent gastric cancer. Upper left quadrant: Exclusion and confirmation; LR+ >10, LR- <0.1. Upper right quadrant: Confirmation only; LR+ >10, LR- >0.1. Lower left quadrant: Exclusion or confirmation; LR+ <10, LR- <0.1. Lower right quadrant: No exclusion or confirmation; LR+ <10, LR- >0.1. Summary LR+ and LR- for index test with 95% confidence intervals. LR+/-, positive/negative likelihood ratio; CECT, contrast-enhanced computed tomography; FDG PET, fluorodeoxyglucose positron emission tomography.

