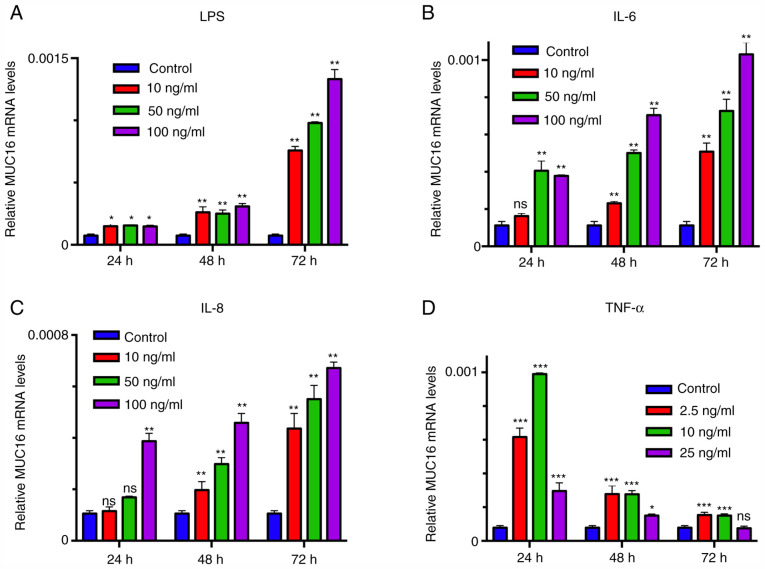
Figure 2.
Screening the optimal concentration and duration of inflammation-associated factor stimulation. HEY cells were treated with different stimulation concentrations of (A) LPS, (B) IL-6, (C) IL-8 and (D) TNF-α for 24, 48 and 72 h. The mRNA expression levels of MUC16 were determined by reverse transcription-quantitative PCR analysis. GAPDH was used as an internal control. Data are presented as the mean ± SEM from triplicate experiments. *P<0.05, **P<0.01 and ***P<0.001 vs. the control group. LPS, lipopolysaccharides; IL, interleukin; TNF, tumor necrosis factor; MUC16, mucin 16 cell surface associated; ns, not significant.

