Figure 4.
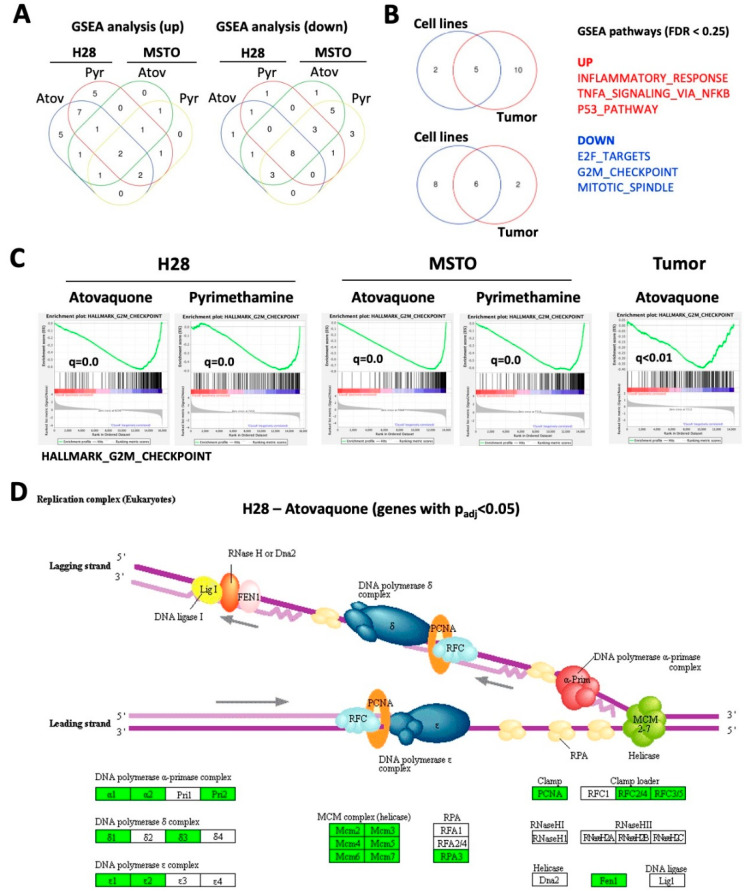
Atovaquone and pyrimethamine regulate pathways involved in cell growth. RNAseq data from H28 (n = 2), MSTO-211H (MSTO) (n = 2) or MS4 mouse tumors (n = 4) treated for 24 h with either pyrimethamine (10 mM), atovaquone (30 mM) or vehicle were used. (A) Gene Set Enrichment Analysis (GSEA) pathway analysis was performed to identify pathways that were upregulated or downregulated in treated cell lines. The Venn diagram indicates the number of common pathways in the various models (FDR < 0.25). (B) GSEA pathways that were identified in at least three cell line models were compared to GSEA pathways identified in atovaquone-treated MS4 tumors (FDR < 0.25). The Venn diagram identifies the number of common pathways and the three most prominent pathways are indicated. (C) Enrichment plots of the Hallmark G2M checkpoint pathway and q-values (FDR approach) for each model are shown. (D) Significantly changed genes (fold change >2 or <0.5; p < 0.05) in atovaquone-treated H28 cells were analyzed for their enrichment in the “replication complex (eukaryotes)” pathway using Pathview (upregulated genes—green, downregulated genes—red).

