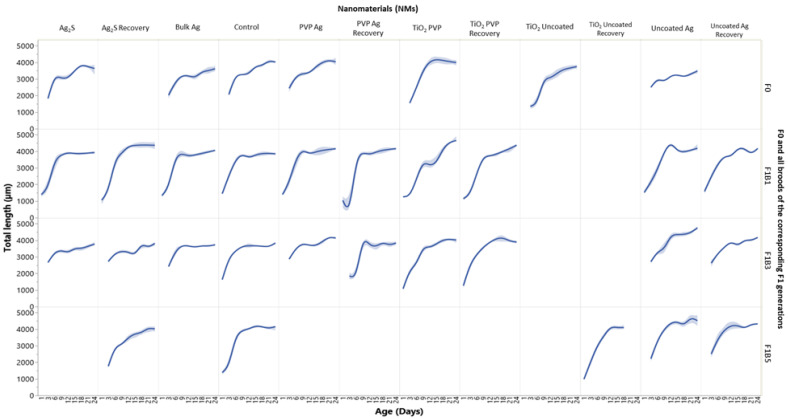
Figure 2.
Size (measured as tail length) versus age for all F0 generations and broods F1B1, F1B3 and F1B5 of the subsequent F1 generations. Data are presented for daphnids continuously exposed to each of the Ag and TiO2 NMs, and those in the recovery sets after removal from exposure. The y-axis indicates the average daphnid length (µm) (measuring from the apex of the helmet to the base of the tail) as a function of the daphnid age (days) on the X-axis. F0 = Parent exposure to the particular NM is noted at the top of the plots. The graph splits horizontally by each of the generations and vertically by the NM exposure condition. The shaded areas around the lines are the 95% confidence bands. N = 5.

