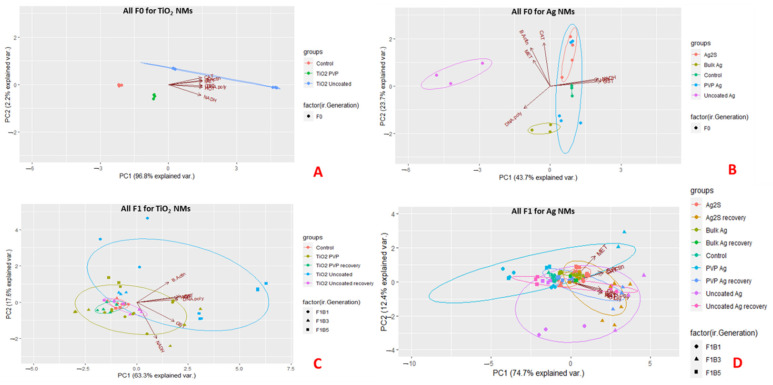
Figure 4.
2D Principal Components Analysis (PCA) variable biplots showing the variation of the exposed and recovery broods responses to the NMs, plotted using their projections onto the first two principal components, combined with the gene expression plotted using their weights for the components. The red arrows indicate the direction of maximum loading of each gene to the overall distribution. The circles (Ag NM treatments only) show the F0 parents, the triangles show the first F1 brood (F1B1), squares show the third F1 brood (F1B3) and the crosses show the fifth F1 broods (F1B5). The colours represent each of the NMs. The PCAs are split into: (A) F0 generations exposed to the TiO2 NMs; (B) All exposed and recovery broods of the F1 generations for the TiO2 NMs; (C) F0 generations exposed to the Ag NMs; and (D) All exposed and recovery broods of the F1 generations for the Ag NMs. PCAs for each of the F1 germline generations (F2-4) are provided in the supporting information. Key = Glutathione S-transferase (GST), dehydrogenase (NADH), β-Actin (B-Actin), catalase (CAT), metallothionein (MET), DNA Polymerase (DNA-poly) and heme-oxygenase-1 (HO1). All genes are normalised to 18S ribosomal RNA (18S).

