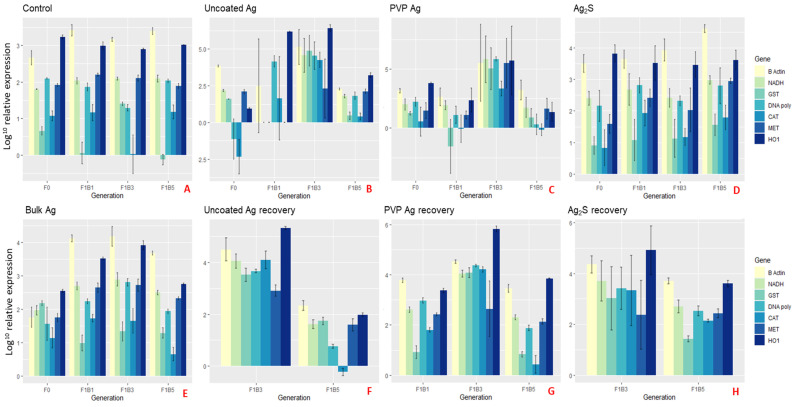
Figure 5.
Gene expression barplots of the average relative expression (Log10) for parent (F0) Daphnia controls (A) or exposed to the different Ag NMs (B–D, F–G) or bulk silver (E), and the relative gene expression levels of the first (F1B1), third (F1B3) and fifth (F1B5) broods born of the F0 Parent in either continuous exposure (B–E) or removed for recovery (F–H), determined after 24 h. Error bars show the standard deviation and the NM gene interaction statistics are presented in Table S34 in the supplementary information. p ≤ 0.05 was considered statistically significant. Key = Glutathione S-transferase (GST), dehydrogenase (NADH), β-Actin (B-Actin), catalase (CAT), metallothionein (MET), DNA Polymerase (DNA-poly) and heme-oxygenase-1 (HO1). All genes are normalised to 18S ribosomal RNA (18S).

