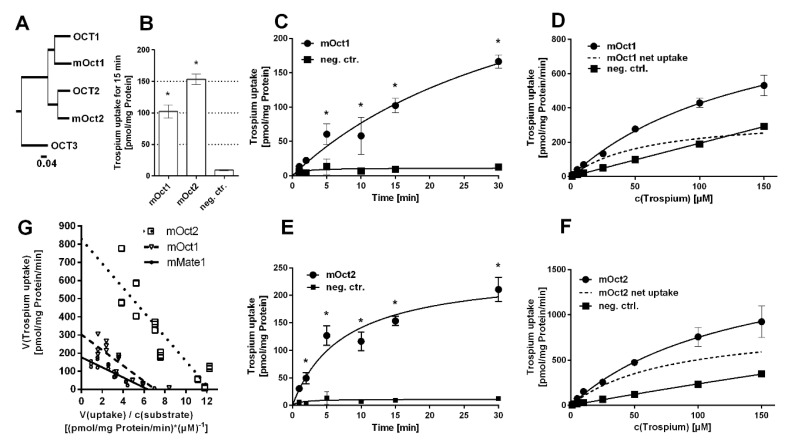
Figure 1.
Trospium uptake by mOct1 and mOct2. (A) Phylogenetic tree of the human and mouse OCT/mOct carriers. The following GenBank accession numbers were used: NP_003048.1 for human OCT1, NP_003049.2 for human OCT2, NP_068812.1 for human OCT3, NP_033228.2 for mOct1, and NP_038695.1 for mOct2. Transport data represent means ± SD of representative experiments each with triplicate determinations. (B) Uptake of 1 µM trospium was analyzed in HEK293 cells stably transfected with mOct1 or mOct2 as indicated and in non-transfected control cells (neg. ctr.) over 15 min. * Significantly different from negative control with p < 0.01 (one-way ANOVA). Time-dependent uptake of 1 µM trospium over 1–30 min of substrate incubation via (C) mOct1 and (E) mOct2. * Significantly different from the respective time-point control with p < 0.01 (two-way ANOVA). Uptake at increasing trospium concentrations via (D) mOct1 and (F) mOct2. Non-transfected HEK293 cells served as control (neg. ctrl.). Carrier-specific uptake is indicated by dotted lines. Michaelis–Menten kinetic parameters were calculated from carrier-specific uptakes by nonlinear regression analysis. (G) Net uptake of trospium by mOct1 (Figure 1D), mOct2 (Figure 1F) and mMate1 (Figure 2D) were plotted as Eadie–Hofstee analysis. Intersection of regression lines with the y-axis indicates Vmax values; the slope indicates negative Km, and intersection with the x-axis indicates Vmax over Km.

