Figure 2.
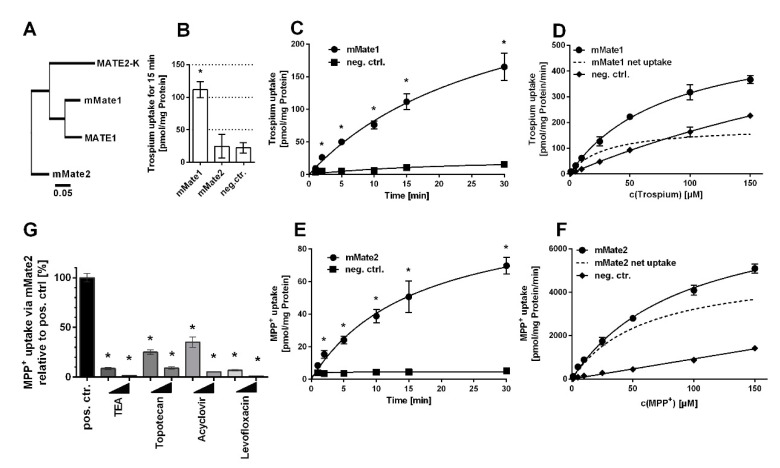
Trospium and MPP+ uptake by mMate1 and mMate2, respectively. (A) Phylogenetic tree of the human and mouse MATE/Mate carriers. The following GenBank accession numbers were used: NP_060712.2 for MATE1, NP_001093116.1 for MATE2-K, NP_080459.2 for mMate1, and NP_001028714.1 for mMate2. Transport data represent means ± SD of representative experiments each with triplicate determinations. (B) Uptake of 1 µM trospium was analyzed in HEK293 cells stably transfected with mMate1 or mMate2 as indicated and in non-transfected control cells (neg. ctr.) over 15 min. * Significantly different from negative control with p < 0.01 (one-way ANOVA). Time-dependent uptake of (C) trospium via mMate1 and (E) MPP+ via mMate2 over 1–30 min. * Significantly different from the respective time-point control with p < 0.01 (two-way ANOVA). Uptake at increasing concentrations of (D) trospium via mMate1 and of (F) MPP+ via mMate2 over 1 min. Non-transfected HEK293 cells served as control (neg. ctrl.). Carrier-specific uptake is indicated by dotted lines. Michaelis–Menten kinetic parameters were calculated from carrier-specific uptakes by nonlinear regression analysis. (G) MPP+ uptake inhibition via mMate2 at 10 µM and 100 µM inhibitor concentrations of TEA, topotecan, acyclovir, and levofloxacin, measured over 30 min. Cells not incubated with any inhibitor served as positive control (set to 100%). * Significantly different from positive control with p < 0.01 (one-way ANOVA).

