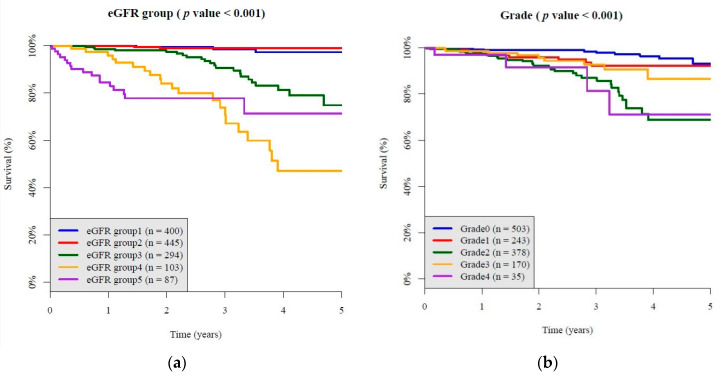
Figure 2.
The Kaplan–Meier survival curve showed progression of diabetic retinopathy comparison in each grade and different tertiles of baseline HbA1C. (a) A stepwise fashion of ESRD incidence in all enrolled participants with different initial grade of diabetic nephropathy; (b) a stepwise fashion of ESRD incidence in all enrolled participants, from mild NPDR to moderate NPDR, to severe NPDR, to PDR.

