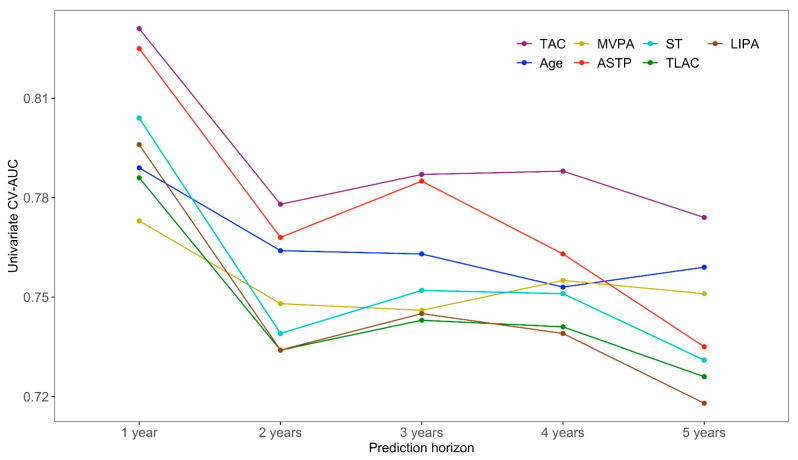
Figure 1.
The cross-validated area under the curve (CV-AUC) values for the top seven predictors in the univariate five-year all-cause mortality logistic regression models across one- to five-year mortality prediction horizons. The x-axis corresponds to the prediction horizon and the y-axis is the CV-AUC (higher indicates better prediction performance).

