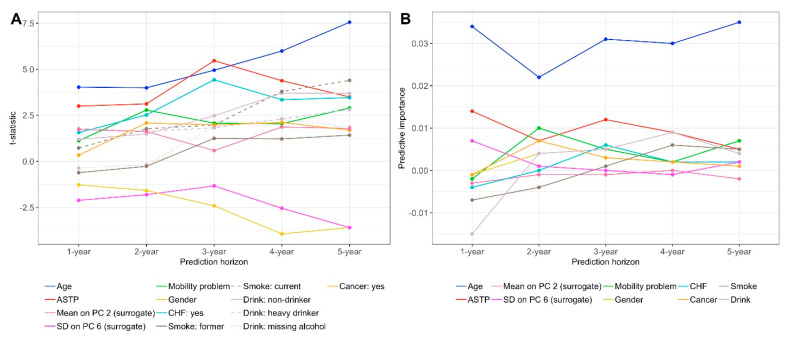
Figure 2.
(A) The t-statistic values of the combined model coefficients in each prediction horizon. Each line corresponds to a t-statistic coefficient value (y-axis) as a function of the horizon prediction model (x-axis). (B) Predictive importance of each variable in the combined model measured by the difference between the CV-AUC of the full combined model and the combined model without that variable across prediction horizons.

