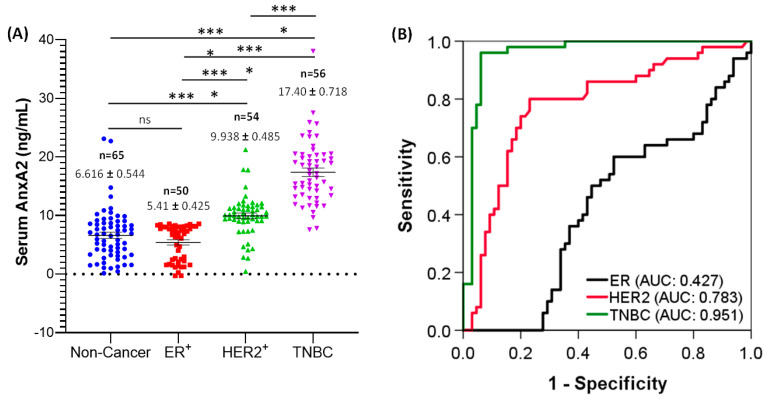
Figure 3.
Serum AnxA2 levels in breast cancer subtypes. (A) Serum AnxA2 expression in normal healthy females (n = 65), ER+ (n = 50), HER2+ (n = 54), and TNBC (n = 56) breast cancer patients. The data are presented as the mean ± SEM (***, p < 0.001; ****, p < 0.0001; one-way ANOVA followed by Tukey multiple comparison test). (B) ROC curves for ER+ (n = 50), HER2+ (n = 54) and TNBC (n = 56) patients versus normal healthy females (n = 65).

