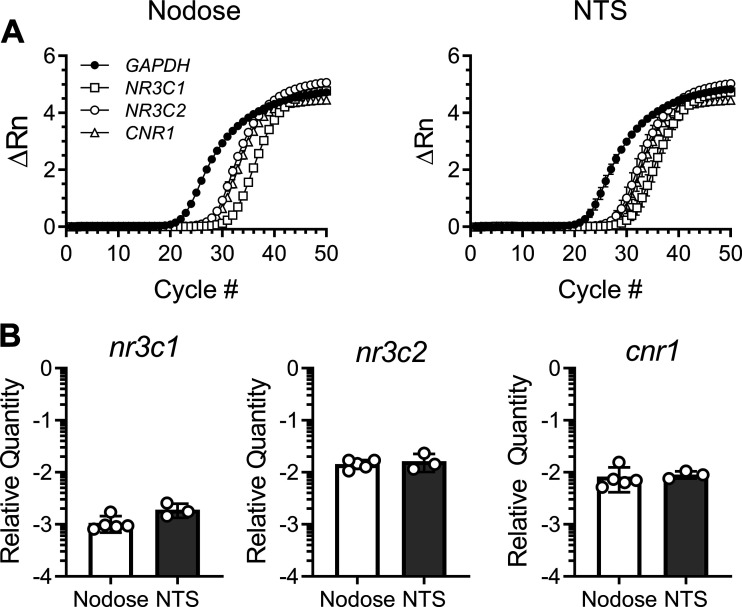
Fig. 5.
Gene expression. A: plots show the ΔRn (baseline subtracted fluorescent reading normalized to the passive reference dye, ROX) of each gene across 50 cycles in cDNA from nodose ganglia (left) and nucleus of the solitary tract (NTS) tissue (right). B: RT-quantitative PCR analysis of genes encoding glucocorticoid receptor (NR3C1), mineralocorticoid receptor (NR3C2), and cannabinoid type-1 receptor (CNR1) from isolated nodose ganglia (n = 5 mice) and NTS slices (n = 3 mice). Gene expression is normalized to GAPDH and shown as 2−ΔCt. Data are expressed as means + SD.

