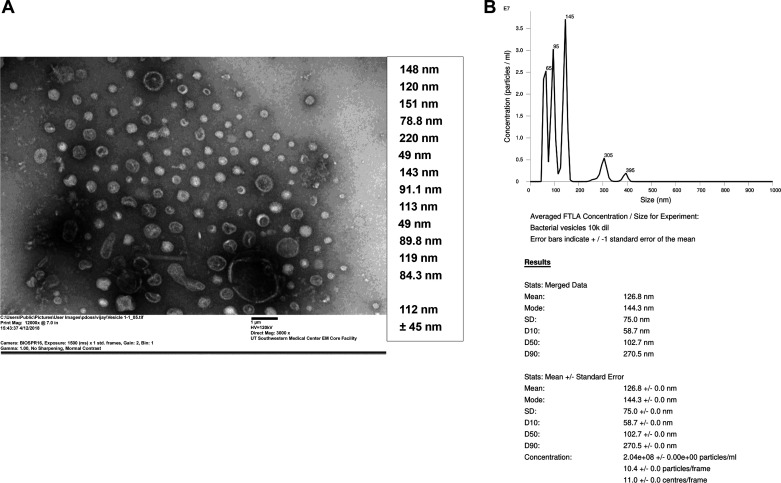
Fig. 1.
Negative staining electron microscopy and size analyses of dust extracellular vesicles (EVs). A: dust EVs were visualized by negative staining electron microscopy using uranyl acetate. A representative electron micrograph with sizes of dust EVs that were randomly selected for measurement is shown. B: a representative size distribution of dust EVs obtained by nanoparticle tracking analysis (NTA) using NanoSight NS300 instrument. EVs (n = 15) isolated from 3 different dust samples were analyzed by NTA.

