Fig. 1.

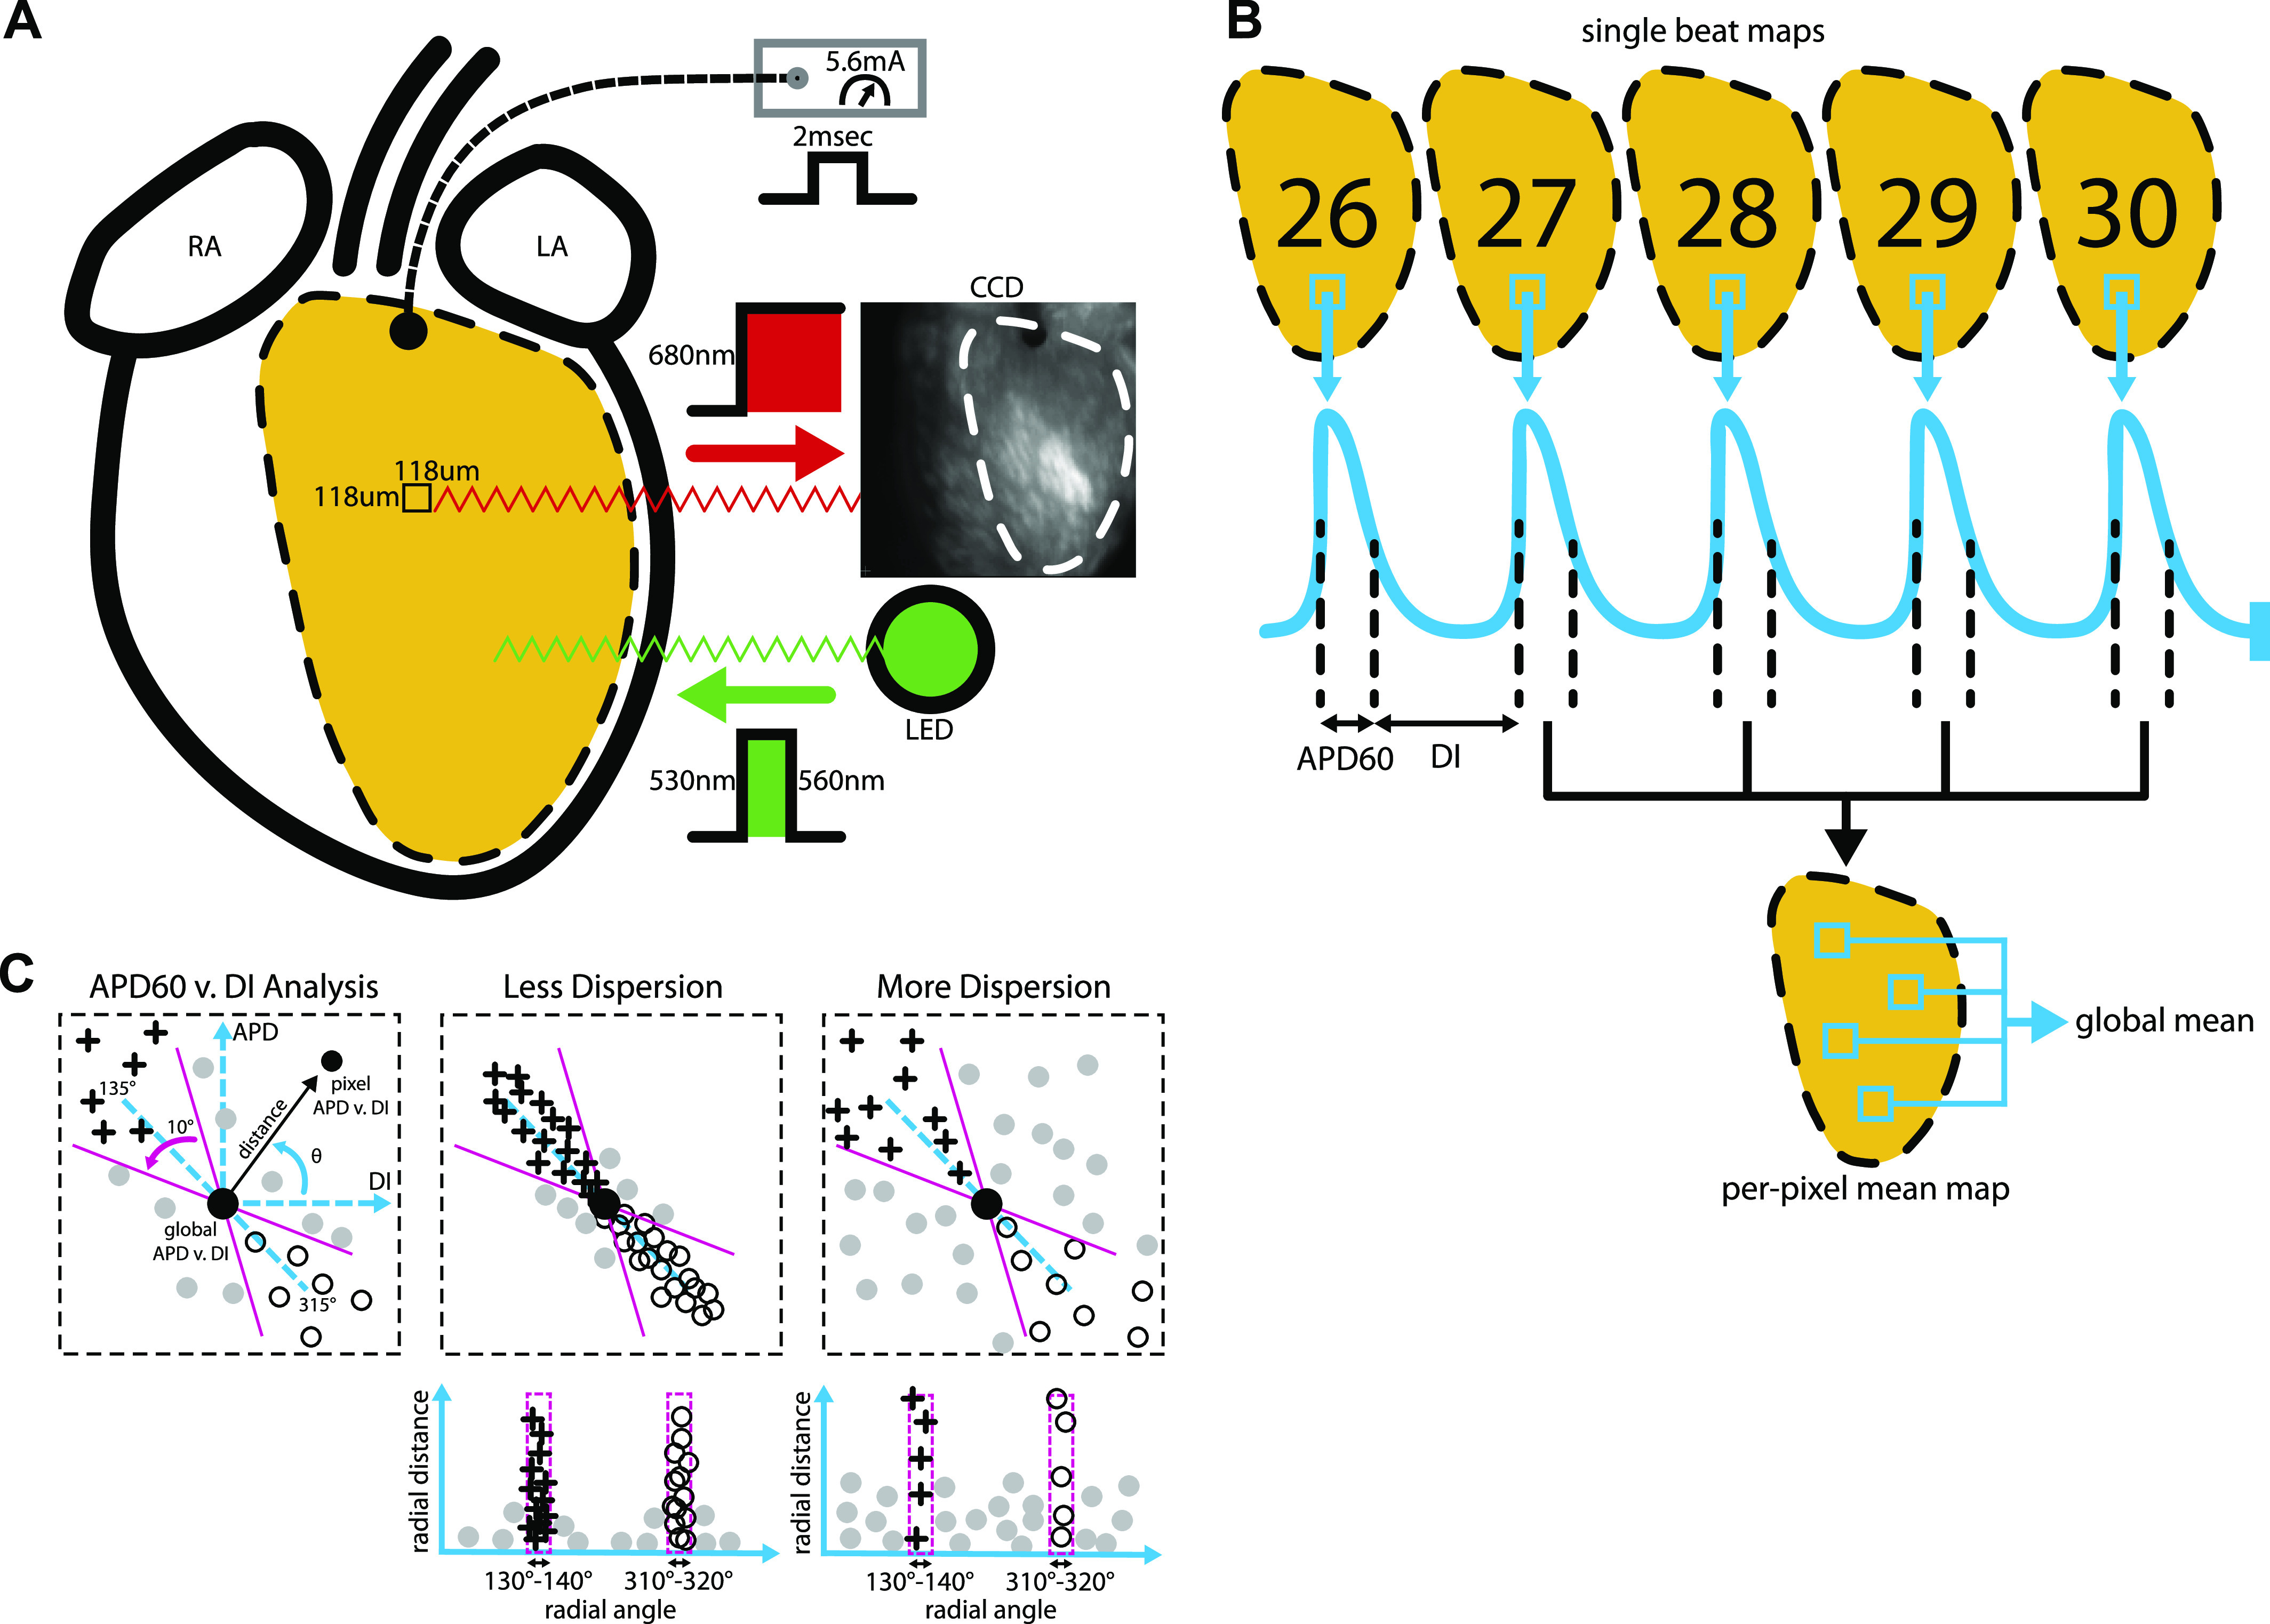
Optical mapping and signal analysis. A: schematic of RH237 fluorescence image acquisition showing excitation and emission wavelengths, the location of the pacing electrode, and LV epicardial region that was mapped. B: illustration of beat analysis for the last five beats of each PCL within the dynamic pacing protocol. After signal measurement for each pixel, per-pixel means were computed from the last four beats. Global means were then computed from per-pixel means. C: APD60 vs. DI dispersion analysis diagrams. Left: scatterplot showing APD60 vs. DI at one PCL and the predicted relationship PCL = APD + DI (blue dotted line). APD60 vs. DI radial distance (black arrow) and radial angle (θ) were measured to quantify the location of each pixel’s APD60 vs. DI point from the global mean APD60 vs. DI restitution point (large filled circle). Middle: scatterplot showing low APD60 vs. DI dispersion (top), with most points falling along the predicted line. Radial distance vs. radial angle plots of low APD60 vs. DI dispersion (bottom) have most points falling within 10° segments centered at 135° (crosses) and 315° (open circles). Right: scatterplot showing high APD60 vs. DI dispersion (top), with many points falling off the predicted line. Radial distance vs. radial angle plots of high APD60 vs. DI dispersion (bottom) have many points falling between 135° and 315°. APD60, action potential duration at 60% repolarization; DI, diastolic interval; LV, left ventricular; PCL, pacing cycle length.
