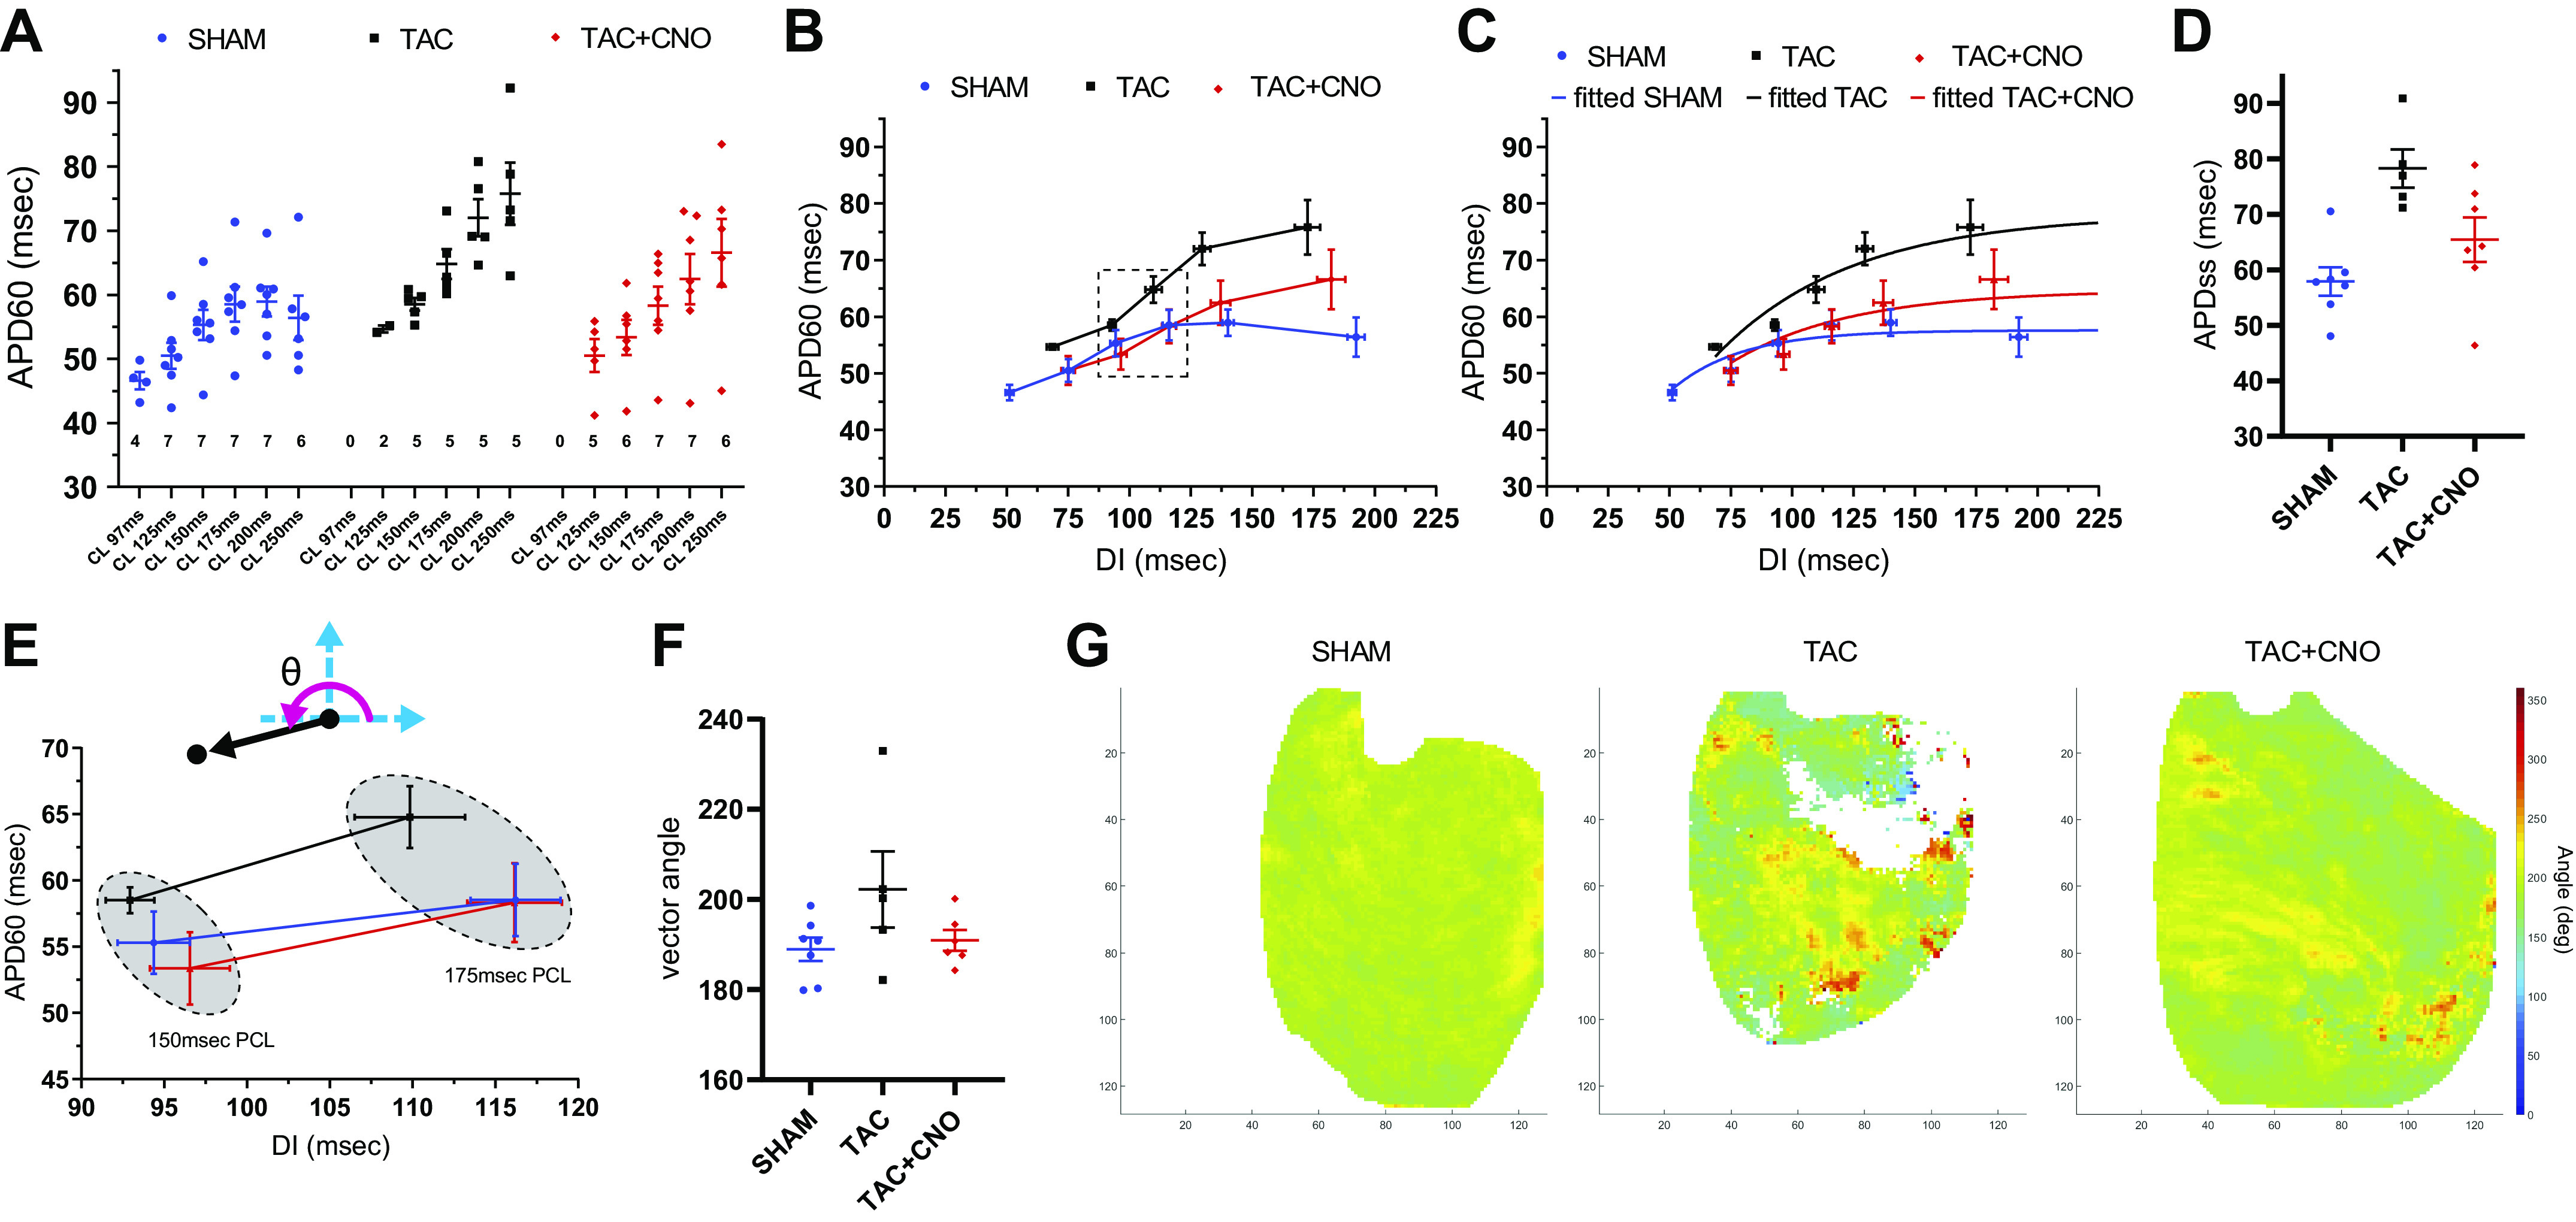
Fig. 3.

APD60 restitution analysis. A: global APD60 mean values for each PCL, with sample size listed below datapoints. B: APD60 restitution plot for captured PCLs using global APD60 (seen in A) and DI mean values. The dotted rectangle denotes the window of data shown in E. C: fitted APD60 restitution curves plotted with restitution points for each PCL. D: APDss computed from each heart’s fitted APD60 restitution curve. P values for group comparisons are listed in Table 1. E: restitution points for 175 ms and 150 ms PCL expanded from the dotted rectangle region shown in B. The definition of restitution vector angle (θ) is shown in the diagram above. F: APD60 restitution vector angles computed from 175 ms PCL to 150 ms PCL (Sham n = 7, TAC n = 5, and TAC + CNO n = 6). P values for group comparisons are listed in Table 1. G: representative APD60 restitution vector angle maps for each group. Axes units are pixels, with 118 µm/pixel. All error bars indicate standard error of the mean (SEM). APD60, action potential duration at 60% repolarization; APDss, APD60 steady state; CNO, clozapine N-oxide; DI, diastolic interval; PCL, pacing cycle length; TAC, transverse-ascending aortic constriction.
