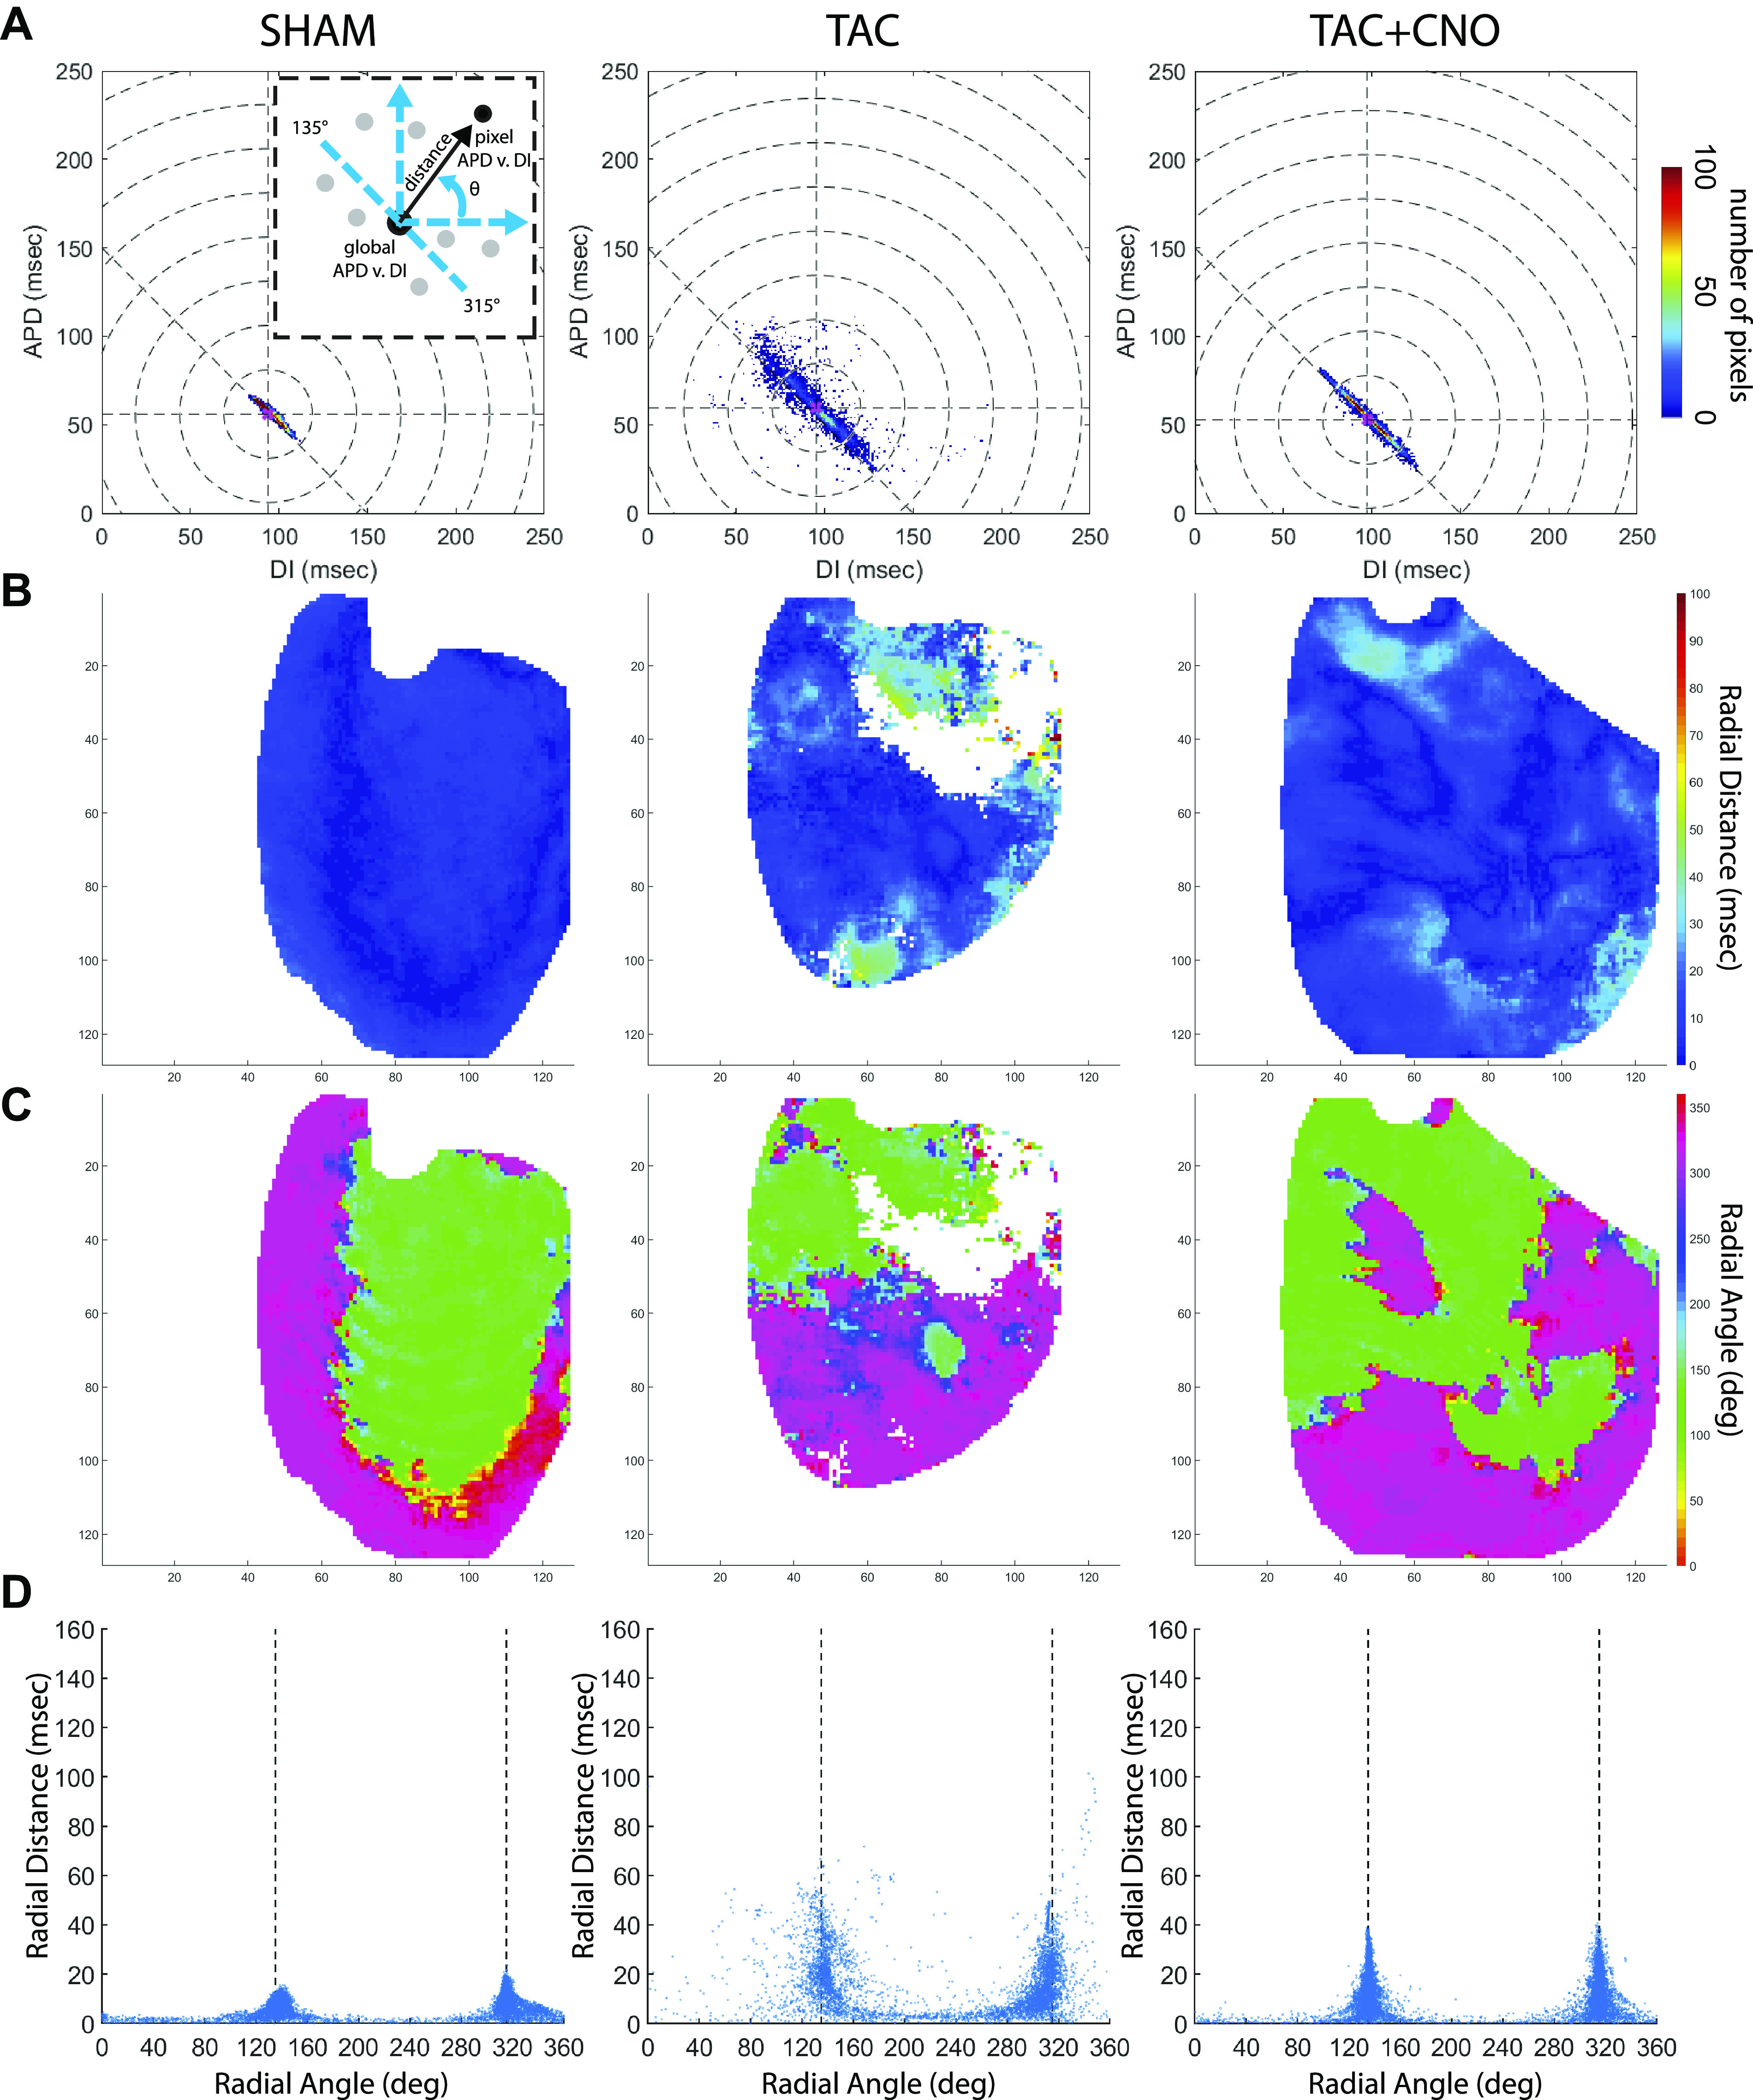
Fig. 5.

APD60 vs. DI dispersion analysis. A: APD60 vs. DI dispersion two-dimensional histograms for 150 ms PCL using each pixel’s per-pixel APD60 and DI mean value. Concentric dotted circles represent 25 ms radial distance from global mean restitution point. Dotted diagonal line represents the predicted PCL = APD + DI line. Schematic inset refreshes Fig. 1C concepts of radial distance (black arrow) and radial angle (θ). B: radial distance maps at 150 ms PCL. C: radial angle maps for 150 ms PCL. Axes units are pixels, with 118 µm/pixel. D: radial distance vs. radial angle scatter plots for 150 ms PCL with line marked for PCL = APD + DI. APD60, action potential duration at 60% repolarization; DI, diastolic interval; PCL, pacing cycle length.
