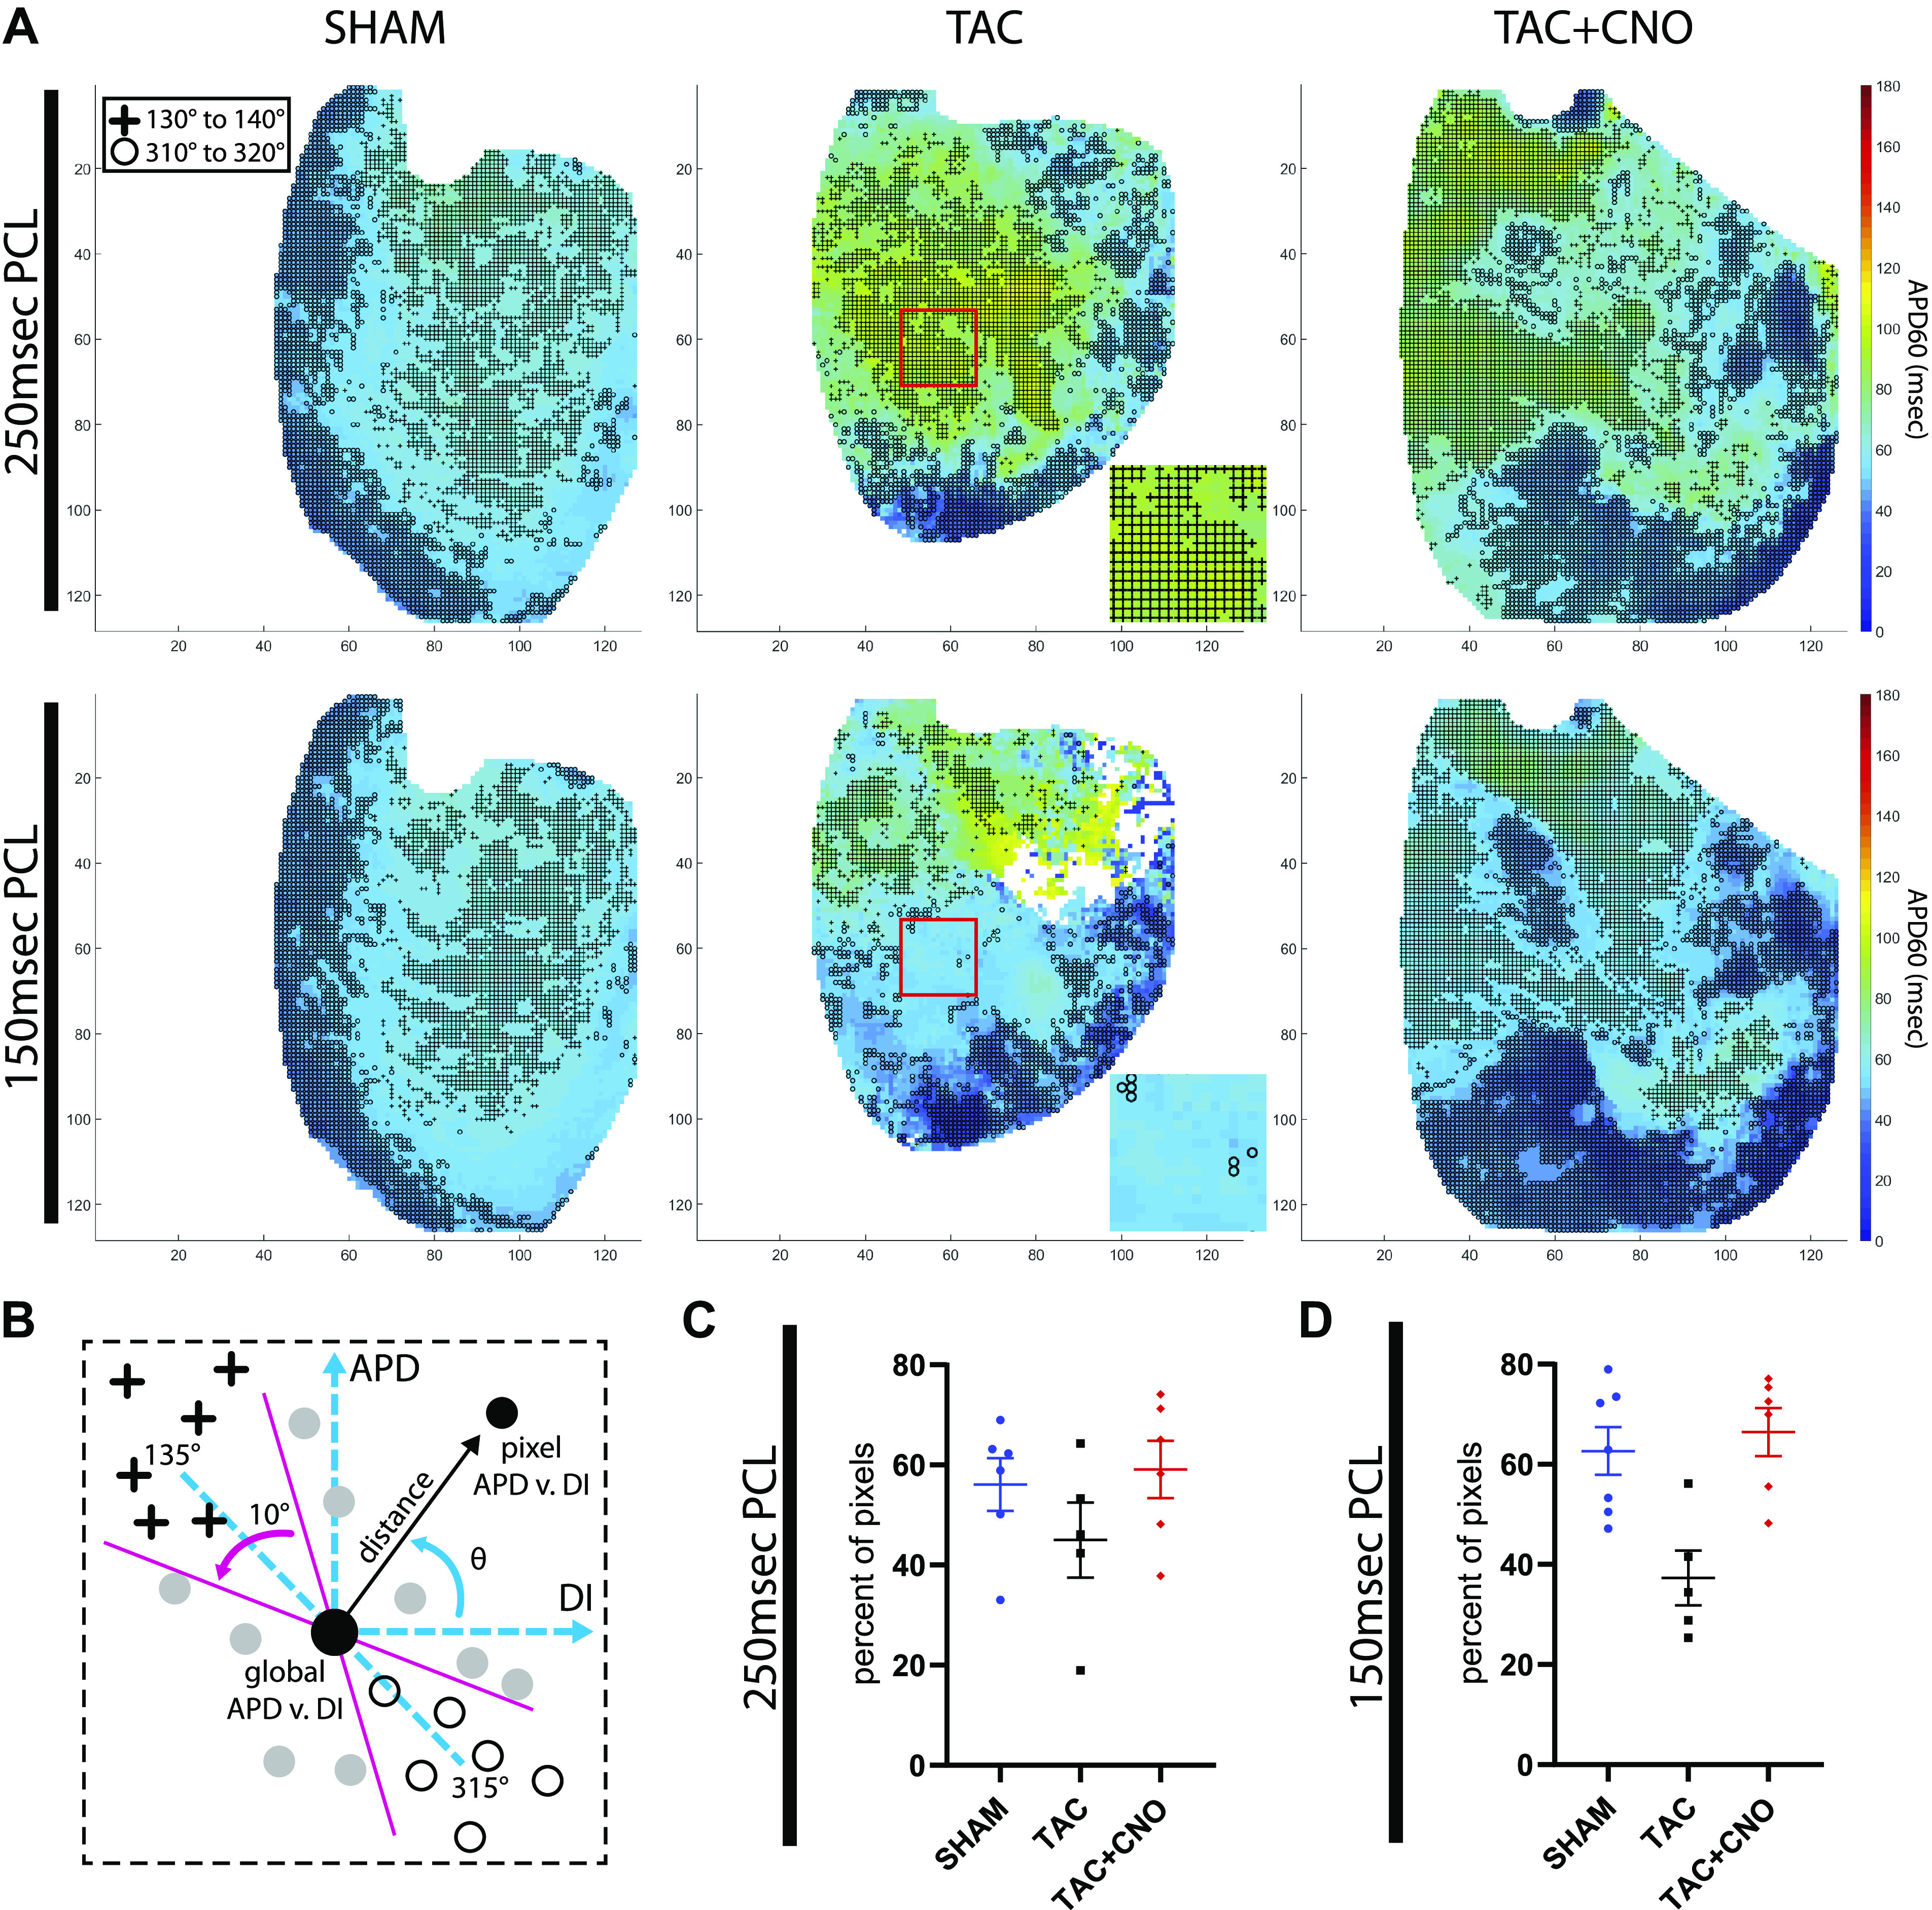
Fig. 6.

Segment analysis for rate responsive tissue. A: per-pixel APD60 mean maps for PCLs 250 ms and 150 ms with markers for pixels that are within the APD60 vs. DI 10° segments centered at 135° (crosses) and 315° (circles) along the predicted PCL = APD + DI line. Red box and corresponding inset for TAC highlights a region of increased APD60 vs. DI dispersion due to loss of pixels in 10° segments at 150 ms PCL. Axes units are pixels, with 118 µm/pixel. B: schematic of segment markers refreshing Fig. 1C. C and D: percent of total pixels lying within these 10° segments of the APD60 vs. DI dispersion for PCLs 250 and 150 ms. P values for group comparisons are listed in Table 1. Sample size for (C) Sham, n = 6; TAC, n = 5; and TAC + CNO, n = 6. Sample size for (D) Sham, n = 7; TAC, n = 5; and TAC + CNO, n = 6. All error bars indicate standard error of the mean (SEM). APD60, action potential duration at 60% repolarization; CNO, clozapine-N-oxide; DI, diastolic interval; PCL, pacing cycle length; TAC, transverse-ascending aortic constriction.
