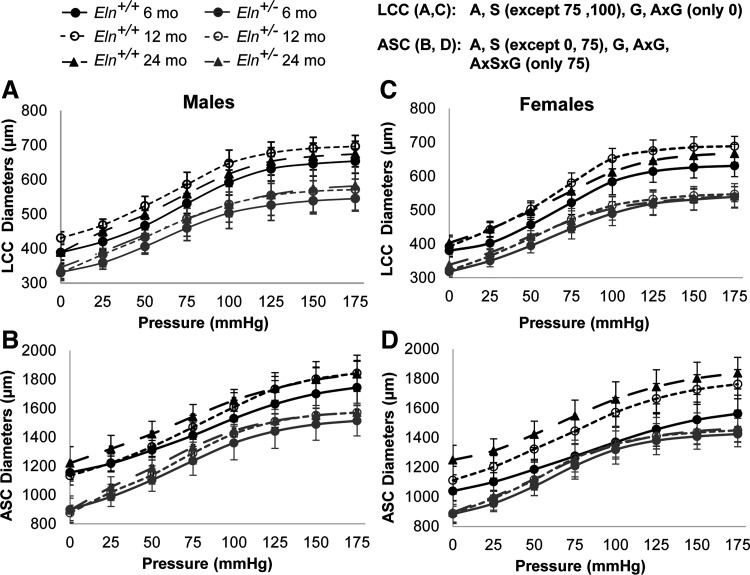
Fig. 7.
Mechanical testing data at the in vivo axial stretch show the outer diameter (µm) at each applied pressure for male (A and B) and female (C and D) Eln+/+ and Eln+/− left common carotid (LCC; A and C) and ascending aorta (ASC; B and D) at 6, 12, and 24 mo of age. The letters at top right indicate independent variables and their interactions with P < 0.05 by three-way ANOVA for each artery type at each pressure step. A, age; S, sex; G, genotype. The exact P values for each comparison are given in Supplemental Table S3 (see https://doi.org/10.6084/m9.figshare.12558818). Means ± SD shown; n = 8–11 for each group.

