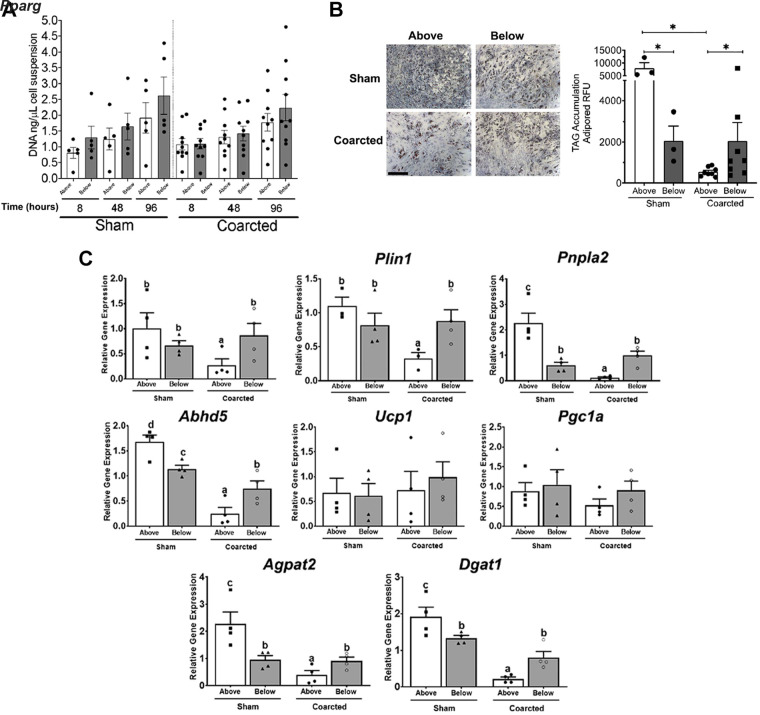
Fig. 3.
A: proliferation of PVAT adipocyte progenitor cells (AP) above (open bar) and below (gray bar) the coarctation from sham (left, n = 4) and coarcted (right, n = 10) male Sprague–Dawley rats at 8, 48, and 96 h of culture. Points are values for individual rats around bars representing means + SE. B, top: representative images of AdipoRed staining in AP from above (left) and below (right) the coarctation in sham and coarcted male Sprague–Dawley rats after 14 days of culture in adipogenic media. Bottom: quantitation of TAG (triglyceride accumulation as adipored RFU) in sham (left, n = 3) or coarcted (right, n = 8) AP from aortic PVAT that was above (open bar) or below (gray bar) the ligature. Points are values for individual rats around bars representing means + SE. *P < 0.05, for one-way ANOVA followed by Tukey’s multiple comparisons. C: gene expression of adipogenic markers by RT qPCR in sham (left, n = 4) or coarcted (right, n = 4) AP from aortic PVAT that was above (open bar) or below (gray bar) the ligature after 14 days of culture in adipogenic media. Values are relative mRNA abundance after normalization with the reference gene Rps29. Significant differences are indicated by letters a, b, c, and d (P < 0.05). PVAT, perivascular adipose tissue; RFU, .

