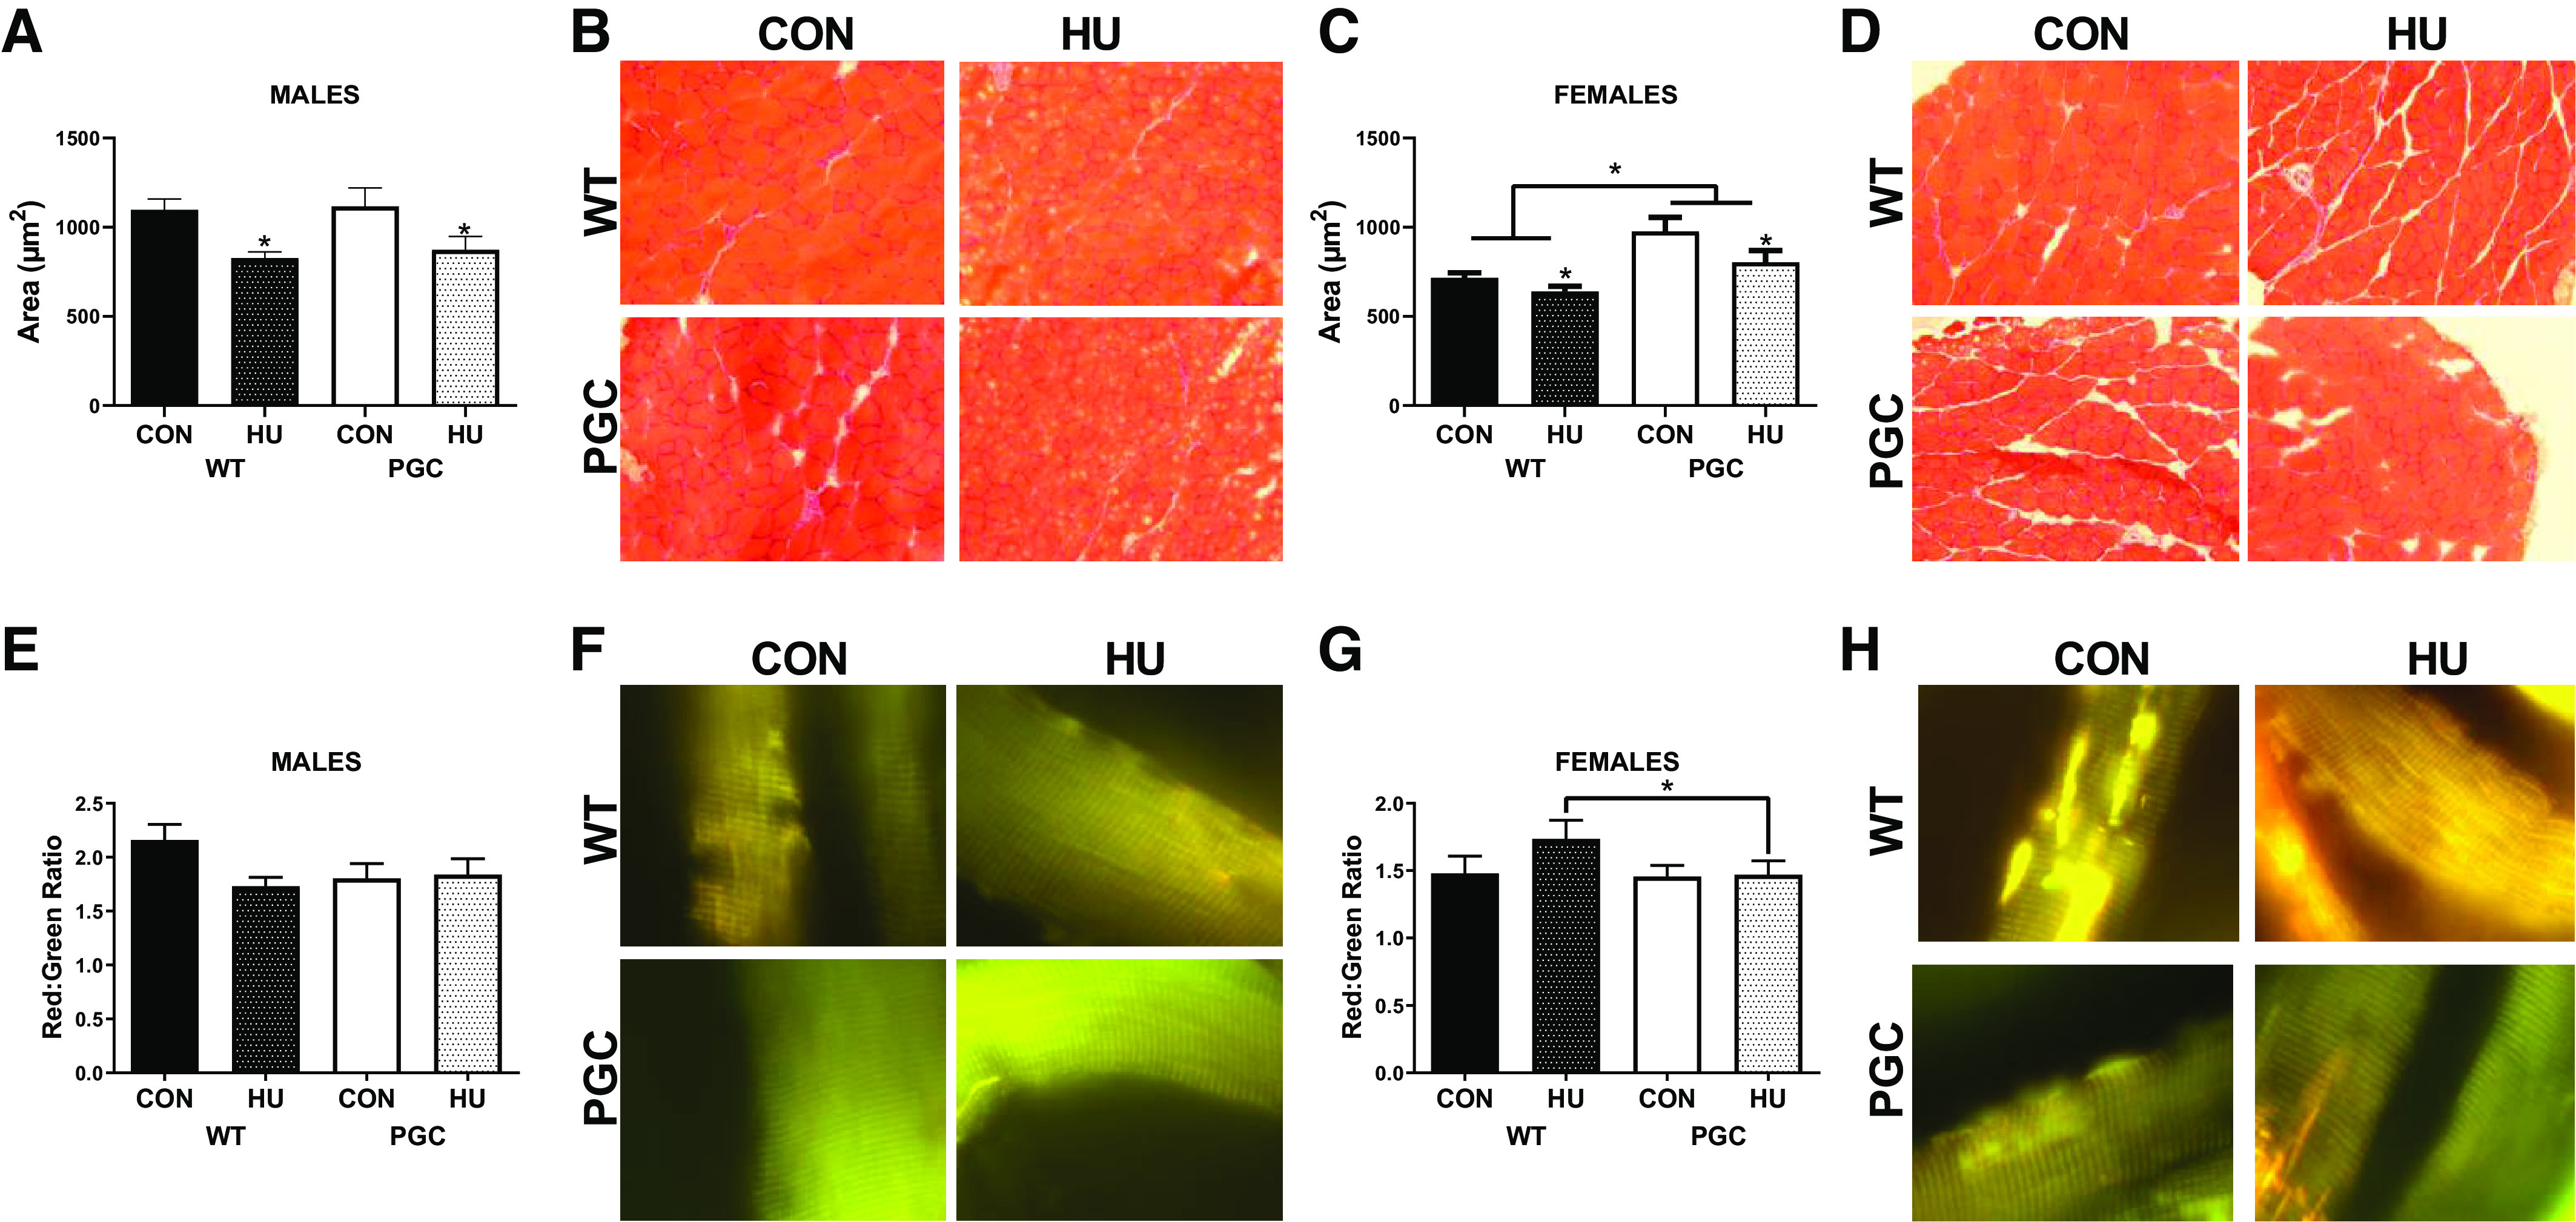
Fig. 1.

Muscle phenotypic data for males and females from PGC colony portion of this study. A: plantaris cross-sectional area (CSA) quantification for males. B: representative images for CSA for males. C: plantaris cross-sectional area (CSA) quantification for females. D: representative images for CSA for females. E: pMitoTimer red/green ratio in males. F: representative images of pMitoTimer in males. G: pMitoTimer red/green ratio in females. H: representative images of pMitoTimer in females. *Tukey-adjusted P < 0.05. All CSA images were taken at ×20 magnification. pMitoTimer images were taken at ×100 magnification. Males had the following sample sizes: WT-CON = 9, WT-HU = 10, PGC-CON = 9, and PGC-HU = 9. Females had the following samples sizes: WT-CON = 8, WT-HU = 9, PGC-CON = 9, and PGC-HU = 9. PGC, peroxisome proliferator-activated receptor gamma coactivator 1-alpha; PGC-CON, peroxisome proliferator-activated receptor gamma coactivator 1-alpha-cage control; PGC-HU, peroxisome proliferator-activated receptor gamma coactivator 1-alpha-humanized; WT-CON, wild-type-cage control; WT-HU, wild-type-humanized.
