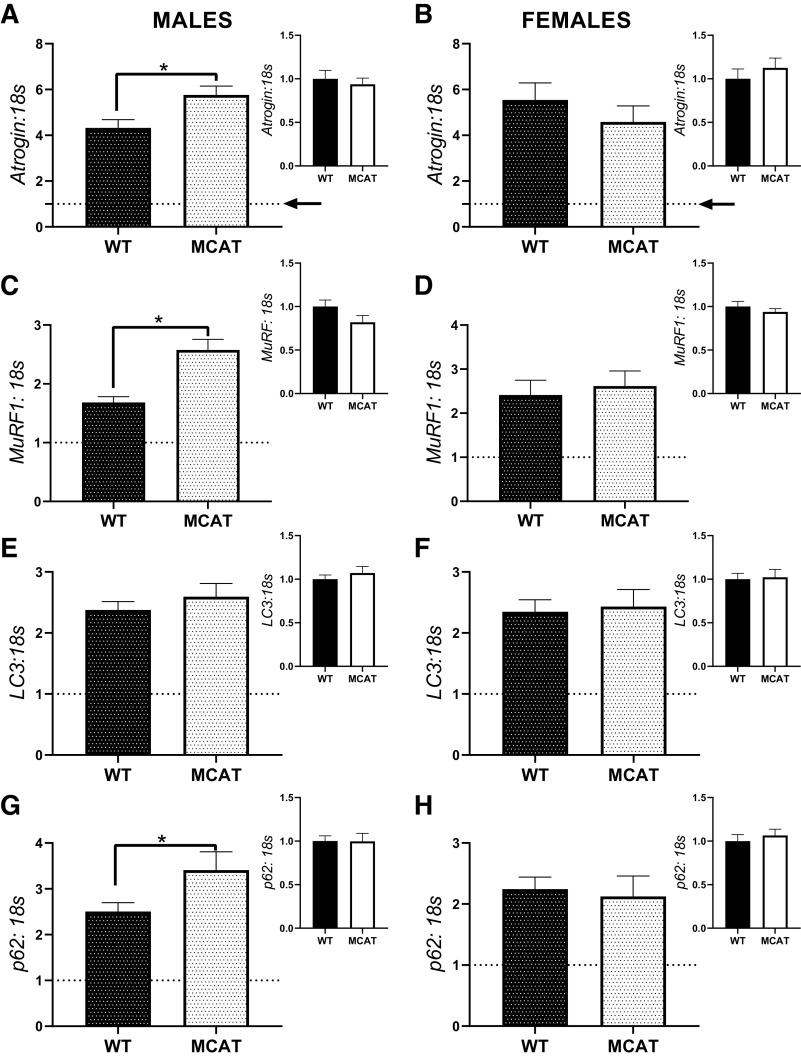
Fig. 4.
mRNA content of moderators of ubiquitin-proteasome and autophagy-mediated catabolism from the soleus muscle of MCAT animals. A: atrogin mRNA response and basal content in males. B: atrogin mRNA response and basal content in females. C: MuRF1 mRNA response and basal content in males. D: MuRF1 mRNA response and basal content in females. E: Lc3 mRNA response and basal content in males. F: Lc3 mRNA response and basal content in females. G: p62 mRNA response and basal content in males. H: p62 mRNA response and basal content in females. Larger graphs show the responses of WT-HU and MCAT-HU, with the inset containing comparisons between WT-CON and MCAT-CON. To demonstrate responses compared with control, 1 (indicating the within genotype basal levels) is graphed with a dotted line. *P < 0.05 from a Student’s t test between genotypes. Males had the following sample sizes: WT-CON = 8, WT-HU = 7, MCAT-CON = 4, and MCAT-HU = 3. Females had the following samples sizes: WT-CON = 5, WT-HU = 6, MCAT-CON = 6, and MCAT-HU = 6. MCAT-CON, mitochondrially targeted catalase-cage control; MCAT-HU, mitochondrially targeted catalase-humanized; WT-CON, wild-type-cage control; WT-HU, wild-type-humanized.

