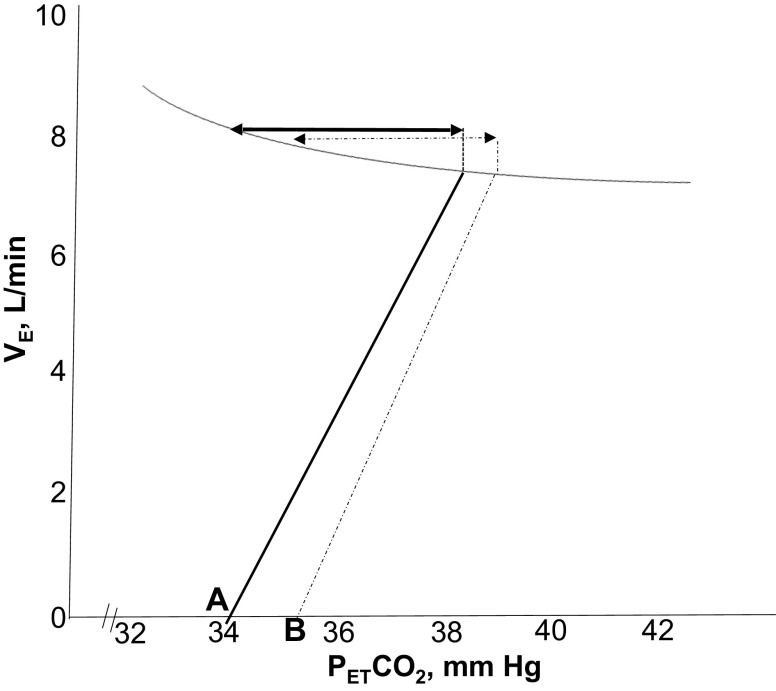
Fig. 5.
Schematic presentation of the relationship between minute ventilation (VE) and end-tidal carbon dioxide () along a representative isometabolic curve. Note a decrease in the slope of VE/ with supplemental O2 (solid line) compared with room air (dashed line), confirming a decline in the hypocapnic ventilatory responsiveness or controller gain upon exposure to supplemental O2. The two-sided arrows indicate the CO2 reserve during the two exposure conditions: a greater magnitude of CO2 reserve with supplemental O2 (solid arrow) compared with room air exposure (dashed arrow) was observed. Points A and B represent the apneic threshold (AT) with supplemental O2 and room air exposure, respectively.

