Figure 7.
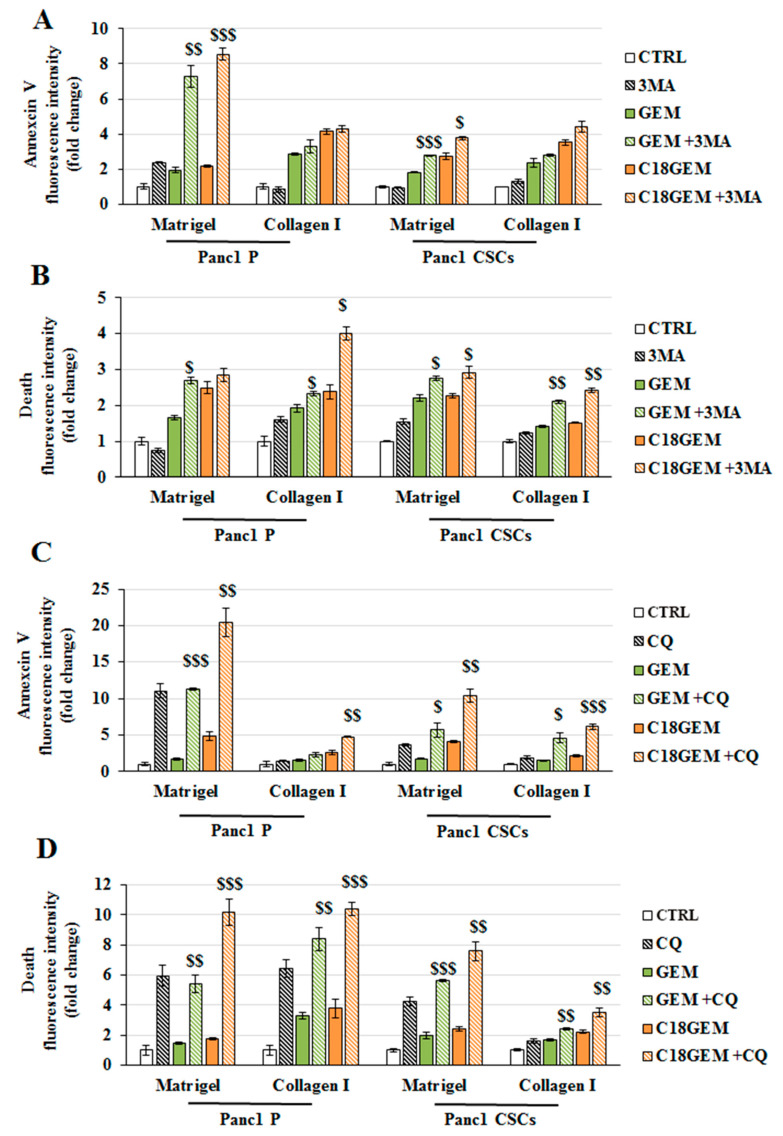
Autophagy inhibition sensitizes Panc1 parental and CSCs growing on different ECM compositions to both GEM and C18GEM treatment. Annexin V (A) and ethidium homodimer (B) fluorescence intensity of parental (P) cells and CSCs treated with 50 μM of GEM or C18GEM for 72 h in Matrigel- and collagen I-rich ECM in the absence or presence of 3 mM 3-MA, an autophagy inhibitor. Annexin V (C) and ethidium homodimer (D) fluorescence intensity of parental (P) cells and CSCs treated with 50 μM of GEM or C18GEM for 72 h in Matrigel- and collagen I-rich ECM in the absence or presence of 100 μM CQ. The values are reported as fold change relative to untreated cells and are the means (±SE) of at least three independent biological replicates. Statistical legend: p < 0.05 ($), p < 0.01 ($$), or p < 0.001 ($$$) GEM or C18GEM versus GEM+3-MA or C18GEM+3-MA.

