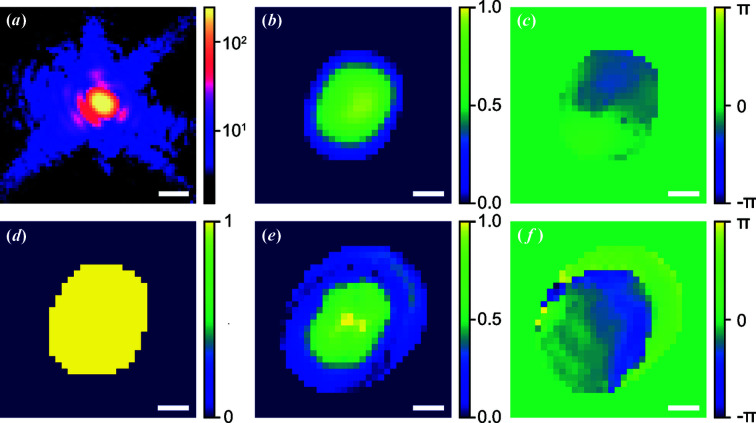
Figure 7.
The performance of the CNN model with measured experimental data. (a) The central slice of a BTO single-particle diffraction pattern. Furthermore, reconstructed (b) amplitude and (c) phase of the BTO particle using the CNN model. (d) Support for the iterative phase-retrieval method, obtained by binarization of the output amplitude from the CNN model. Moreover, reconstructed (e) amplitude and (f) phase of the BTO particle using the combination of the iterative phase-retrieval method and the CNN model. Here, the scale bar is 50 µm−1 for (a). For (b)–(f), all scale bars are 100 nm.

