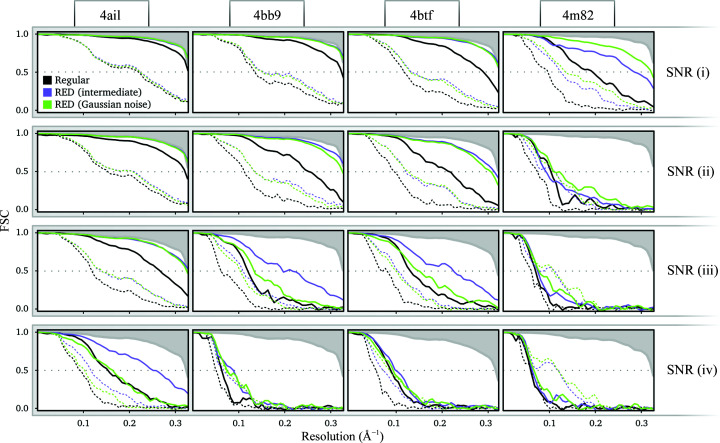
Figure 2.
FSCs of reconstructions at four different SNRs (rows) of four structures (columns). Regular RELION (black) is compared with RED using a denoiser trained on Gaussian noise (green) and on RELION intermediate reconstructions (purple). Dotted lines show the half-map FSC and solid lines show the FSC between the regularized map and the ground truth. All maps were first multiplied with a solvent mask with a smooth edge before comparison with the ground truth. The upper shaded area shows the FSC when the model is reconstructed with zero angular error.

