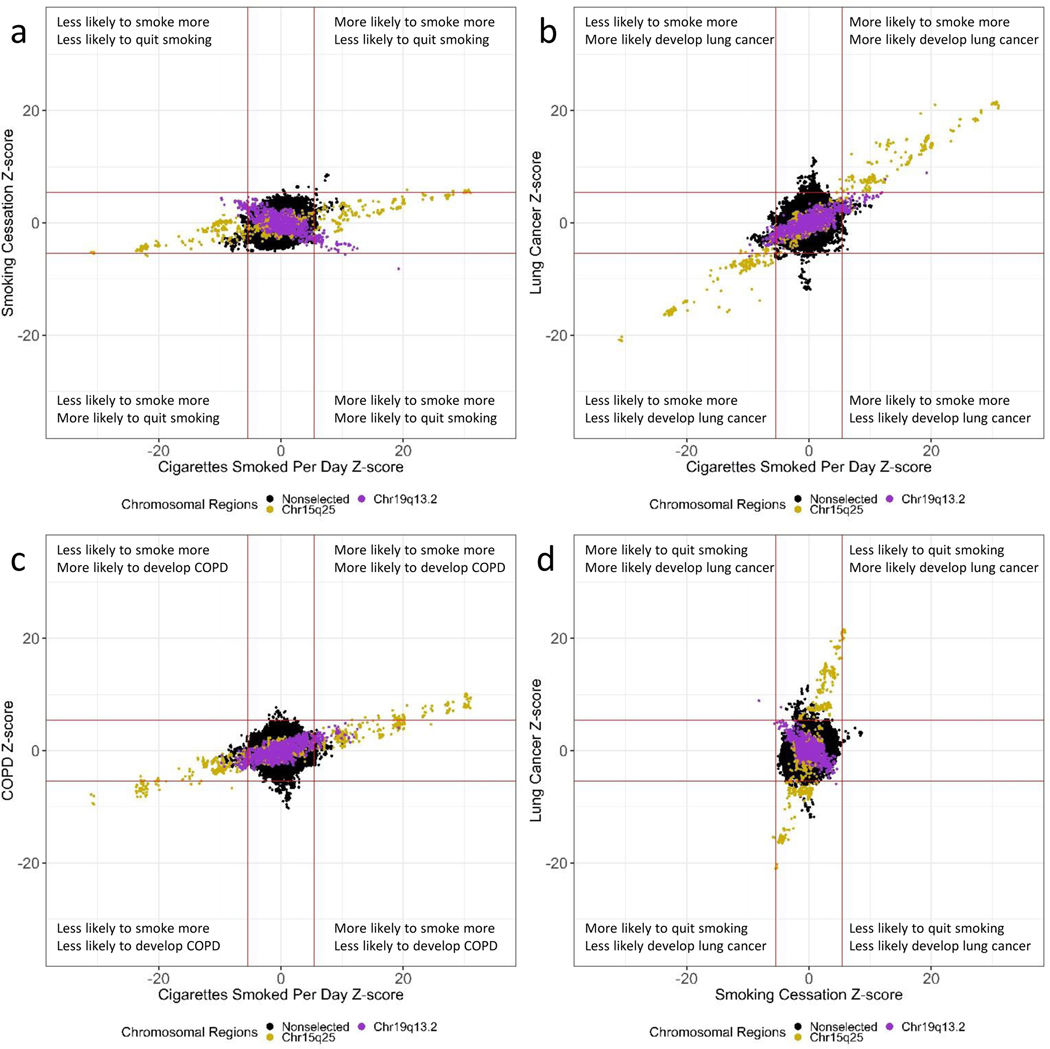
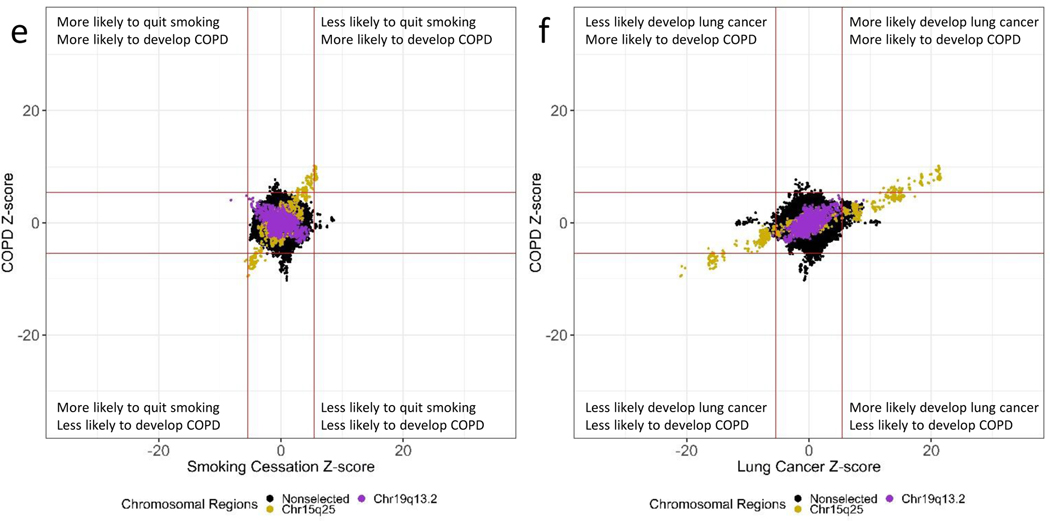
Figure 2. ZZ-plots reveal strong correlations of chromosomal regions 15q25 and 19q13.2.
a. Comparing cigarettes smoked per day (y-axis) and smoking cessation (x-axis).
b. Comparing cigarettes smoked per day (y-axis) and lung cancer (x-axis).
c. Comparing cigarettes smoked per day (y-axis) and COPD (x-axis).
d. Comparing smoking cessation (y-axis) and lung cancer (x-axis).
e. Comparing smoking cessation (y-axis) and COPD (x-axis).
f. Comparing lung cancer (y-axis) and COPD (x-axis).
Each dot represents a SNP. The solid red line represents the genome-wide significance value (p-value = 5.00×10⁻⁸) converted to a z-score format. The chromosomal region 15q25.1 is color-coded gold. The chromosomal region 19q13.2 is color-coded purple. All other SNPs that were not in chromosomal regions 15.q25.1 and 19q13.2 were color-coded black.


