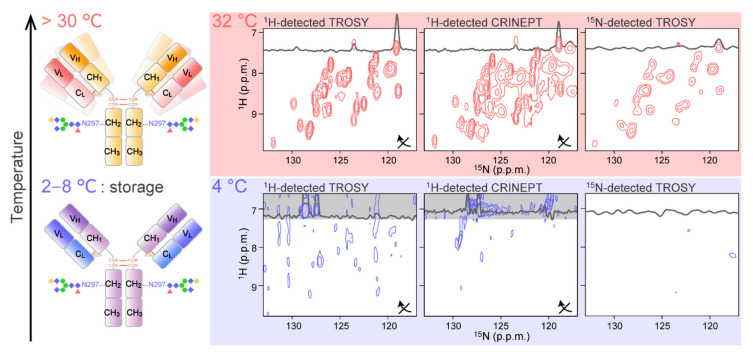
Figure 2.
Application of conventional 2D 1H-15N correlation experiments to mAb. The spectra were recorded at (top) 32 °C and (bottom) 4 °C for an intact [15N-Ala] IgG. For each condition, the 1H-detected TROSY (left), 1H-detected CRINEPT (middle), and the 15N-detected TROSY (right) were recorded. For 1H-detected spectra, the 1H and 15N axes of the spectra are transposed as indicated by arrows. The figure is reproduced from [67].

