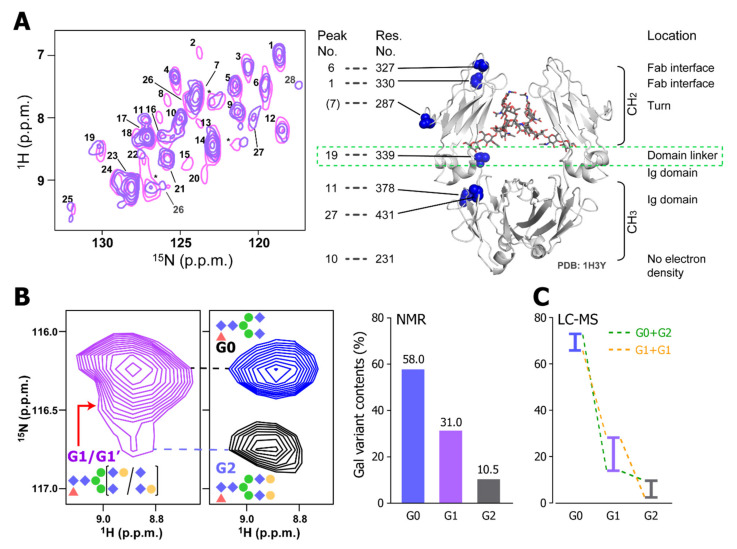
Figure 4.
The HOS analysis of a mAb using a 15N-detected CRINEPT experiment. (A) Overlaid 15N-detected CRINEPT spectra of [15N-Ala] mAb in SC (pink) and IV (blue) formulations. The assignments are based on the chemical shifts of the Ala resonances of the Fc fragment. as previously reported [51]. The structure of the Fc fragment (1H3Y) [72] is shown along with the positions of Ala residues. Signals from 15N TROSY components are labeled with numbers. (B) The heterogeneity of the galactosylation states analyzed by the 15N-detected CRINEPT experiment. Left: the 1H–15N resonance of Lys-248 in the 15N-detected CRINEPT spectrum of the intact mAb is shown along with those from the ΔGal (blue) and Gal (black) samples, which are enzymatically galactosidated and galactosylated, respectively. Right: ratios of different galactosylation states, estimated from the deconvolution of the Lys-248 resonance in the intact mAb. (C) Ratios of different galactosylation states by LC–MS analysis. Reflecting that the analysis cannot discriminate G0_G2 and G1_G1 states, each bar represents the upper and lower limits of the indicated population. The figure is reproduced from [67].

